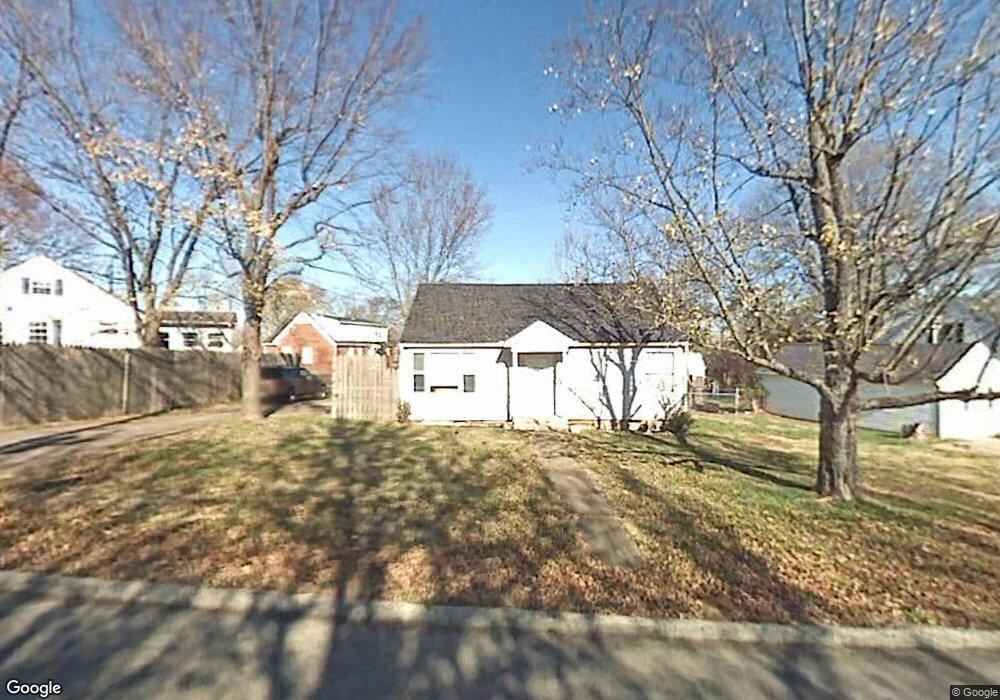
413 8th Ave S Lewisburg, TN 37091
Estimated Value: $134,000 - $170,000
--
Bed
1
Bath
884
Sq Ft
$177/Sq Ft
Est. Value
About This Home
This home is located at 413 8th Ave S, Lewisburg, TN 37091 and is currently estimated at $156,518, approximately $177 per square foot. 413 8th Ave S is a home located in Marshall County with nearby schools including Marshall Elementary School, Oak Grove Elementary School, and Westhills Elementary School.
Ownership History
Date
Name
Owned For
Owner Type
Purchase Details
Closed on
Nov 23, 2016
Sold by
Poarch Jeff L
Bought by
Matheson Pete and Matheson Linda
Current Estimated Value
Purchase Details
Closed on
Aug 26, 2011
Sold by
Harmon Joshua D
Bought by
Poarch Jeff L
Purchase Details
Closed on
Sep 2, 2005
Bought by
Winsett Harmon Joshua D Whitney L
Home Financials for this Owner
Home Financials are based on the most recent Mortgage that was taken out on this home.
Original Mortgage
$63,500
Interest Rate
5.77%
Mortgage Type
Cash
Purchase Details
Closed on
Aug 22, 2003
Sold by
William Parrish
Bought by
William Parrish
Purchase Details
Closed on
Jul 17, 2003
Sold by
Ellen Rozar Rosie
Bought by
William Parrish
Purchase Details
Closed on
Mar 13, 1995
Sold by
Fox Sheila P
Bought by
Ellen Tallent Rosie
Purchase Details
Closed on
Feb 28, 1992
Bought by
Fox Sheila P
Purchase Details
Closed on
Oct 4, 1988
Bought by
Sands Ritchie D and Sands Anita
Create a Home Valuation Report for This Property
The Home Valuation Report is an in-depth analysis detailing your home's value as well as a comparison with similar homes in the area
Home Values in the Area
Average Home Value in this Area
Purchase History
| Date | Buyer | Sale Price | Title Company |
|---|---|---|---|
| Matheson Pete | $40,000 | -- | |
| Poarch Jeff L | $50,900 | -- | |
| Winsett Harmon Joshua D Whitney L | $63,500 | -- | |
| William Parrish | $27,500 | -- | |
| William Parrish | $55,000 | -- | |
| Ellen Tallent Rosie | $49,000 | -- | |
| Fox Sheila P | $40,800 | -- | |
| Sands Ritchie D | $33,000 | -- |
Source: Public Records
Mortgage History
| Date | Status | Borrower | Loan Amount |
|---|---|---|---|
| Previous Owner | Sands Ritchie D | $63,500 |
Source: Public Records
Tax History Compared to Growth
Tax History
| Year | Tax Paid | Tax Assessment Tax Assessment Total Assessment is a certain percentage of the fair market value that is determined by local assessors to be the total taxable value of land and additions on the property. | Land | Improvement |
|---|---|---|---|---|
| 2024 | -- | $21,075 | $5,000 | $16,075 |
| 2023 | $654 | $21,075 | $5,000 | $16,075 |
| 2022 | $654 | $21,075 | $5,000 | $16,075 |
| 2021 | $644 | $13,850 | $3,250 | $10,600 |
| 2020 | $644 | $13,850 | $3,250 | $10,600 |
| 2019 | $623 | $13,850 | $3,250 | $10,600 |
| 2018 | $617 | $13,850 | $3,250 | $10,600 |
| 2017 | $617 | $13,850 | $3,250 | $10,600 |
| 2016 | $641 | $12,525 | $3,000 | $9,525 |
| 2015 | $585 | $12,525 | $3,000 | $9,525 |
| 2014 | $585 | $12,525 | $3,000 | $9,525 |
Source: Public Records
Map
Nearby Homes
- 610 Forrest St
- 525 Maple St
- 518 Maple St
- 632 Colburn Dr
- 640 6th Ave S
- 215 5th Ave N
- 966 Berry St
- 251 Joyce Ave
- 117 W End Ave N
- 726 Thomas Ave
- 1221 W Commerce St
- 0 New Lake Rd Unit RTC3030964
- 108 W End Ave N
- 240 Joyce Ave
- 1111 W End Ave N
- 0 Joyce Ave
- 347 Oakwood Dr
- 316 Haynes St
- 718 Midway St
- 1371 W Commerce St