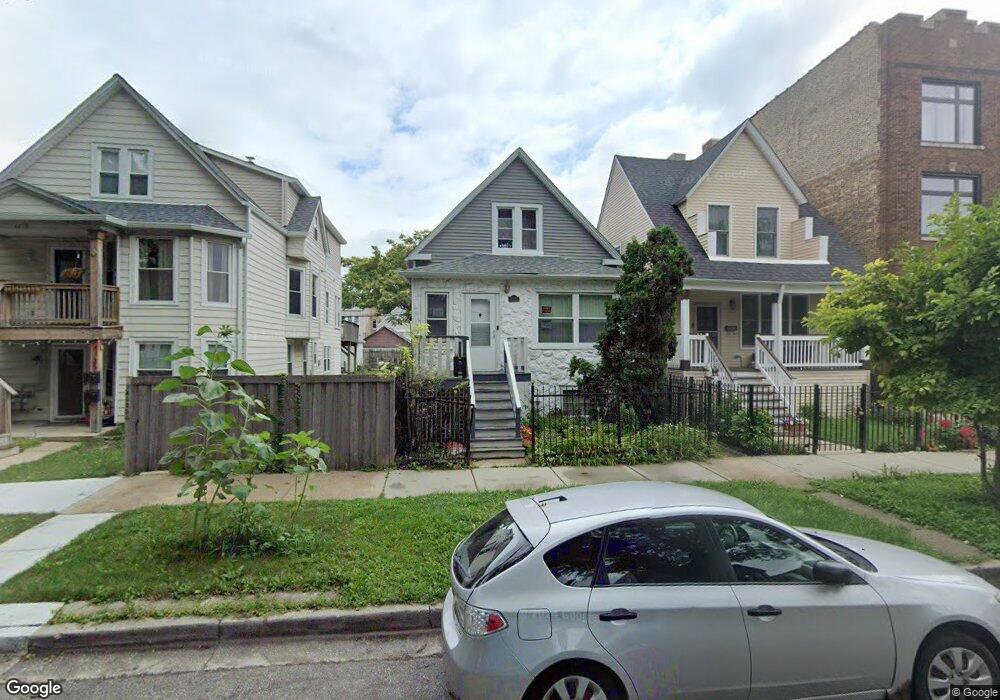
4133 N Saint Louis Ave Chicago, IL 60618
Irving Park NeighborhoodEstimated Value: $389,000 - $454,000
2
Beds
1
Bath
854
Sq Ft
$504/Sq Ft
Est. Value
About This Home
This home is located at 4133 N Saint Louis Ave, Chicago, IL 60618 and is currently estimated at $430,041, approximately $503 per square foot. 4133 N Saint Louis Ave is a home located in Cook County with nearby schools including Henry Elementary School, Roosevelt High School, and CICS Irving Park.
Ownership History
Date
Name
Owned For
Owner Type
Purchase Details
Closed on
Jul 20, 1999
Sold by
Moreno Antelmo and Bahena Felipe
Bought by
Chassagne Jean Claude and Chassagne Sonia
Current Estimated Value
Home Financials for this Owner
Home Financials are based on the most recent Mortgage that was taken out on this home.
Original Mortgage
$120,000
Outstanding Balance
$33,959
Interest Rate
7.69%
Estimated Equity
$396,082
Purchase Details
Closed on
Mar 18, 1997
Sold by
Moreno Santiago
Bought by
Bahena Felipe and Moreno Antelmo
Purchase Details
Closed on
Feb 13, 1995
Sold by
Davila Hector L and Davila Luz N
Bought by
Bahena Felipe and Moreno Antelmo
Home Financials for this Owner
Home Financials are based on the most recent Mortgage that was taken out on this home.
Original Mortgage
$109,200
Interest Rate
9.13%
Create a Home Valuation Report for This Property
The Home Valuation Report is an in-depth analysis detailing your home's value as well as a comparison with similar homes in the area
Home Values in the Area
Average Home Value in this Area
Purchase History
| Date | Buyer | Sale Price | Title Company |
|---|---|---|---|
| Chassagne Jean Claude | $135,000 | Chicago Title Insurance Co | |
| Bahena Felipe | -- | -- | |
| Bahena Felipe | $115,000 | Attorneys Natl Title Network |
Source: Public Records
Mortgage History
| Date | Status | Borrower | Loan Amount |
|---|---|---|---|
| Open | Chassagne Jean Claude | $120,000 | |
| Previous Owner | Bahena Felipe | $109,200 |
Source: Public Records
Tax History Compared to Growth
Tax History
| Year | Tax Paid | Tax Assessment Tax Assessment Total Assessment is a certain percentage of the fair market value that is determined by local assessors to be the total taxable value of land and additions on the property. | Land | Improvement |
|---|---|---|---|---|
| 2024 | $3,772 | $33,000 | $16,997 | $16,003 |
| 2023 | $3,953 | $38,000 | $15,750 | $22,250 |
| 2022 | $3,953 | $38,000 | $15,750 | $22,250 |
| 2021 | $6,995 | $38,000 | $15,750 | $22,250 |
| 2020 | $4,420 | $22,875 | $6,930 | $15,945 |
| 2019 | $4,432 | $25,417 | $6,930 | $18,487 |
| 2018 | $4,356 | $25,417 | $6,930 | $18,487 |
| 2017 | $3,900 | $21,432 | $6,300 | $15,132 |
| 2016 | $4,031 | $22,556 | $6,300 | $16,256 |
| 2015 | $3,665 | $22,556 | $6,300 | $16,256 |
| 2014 | $3,521 | $21,477 | $5,670 | $15,807 |
| 2013 | $3,440 | $21,477 | $5,670 | $15,807 |
Source: Public Records
Map
Nearby Homes
- 4155 N Bernard St Unit G
- 4143 N Drake Ave
- 4207 N Drake Ave
- 4246 N Kimball Ave
- 3558 W Belle Plaine Ave Unit 3
- 4249 N Central Park Ave
- 4026 N Kimball Ave
- 3551 W Belle Plaine Ave Unit 2
- 4322 N Kimball Ave
- 3247 W Berteau Ave
- 4248 N Sawyer Ave
- 3222 W Berteau Ave Unit 2
- 4103 N Lawndale Ave Unit 202
- 3940 N Christiana Ave
- 3223 W Belle Plaine Ave
- 3925 N Saint Louis Ave
- 3923 N Bernard St
- 3550 W Montrose Ave Unit 107
- 4116 N Kedzie Ave
- 4252 N Lawndale Ave
- 4131 N Saint Louis Ave
- 4135 N Saint Louis Ave Unit 2
- 4135 N Saint Louis Ave Unit 1
- 4135 N Saint Louis Ave
- 4129 N St Louis Ave Unit 2
- 4141 N Saint Louis Ave Unit 1
- 4141 N Saint Louis Ave
- 4125 N Saint Louis Ave
- 4143 N Saint Louis Ave
- 4121 N Saint Louis Ave
- 4145 N Saint Louis Ave
- 4130 N Bernard St Unit 2
- 4130 N Bernard St
- 4134 N Bernard St
- 4119 N Saint Louis Ave
- 4136 N Bernard St
- 4136 N Bernard St
- 4119 Saint Louis Ave
- 4119 N St Louis Ave
- 4149 N Saint Louis Ave