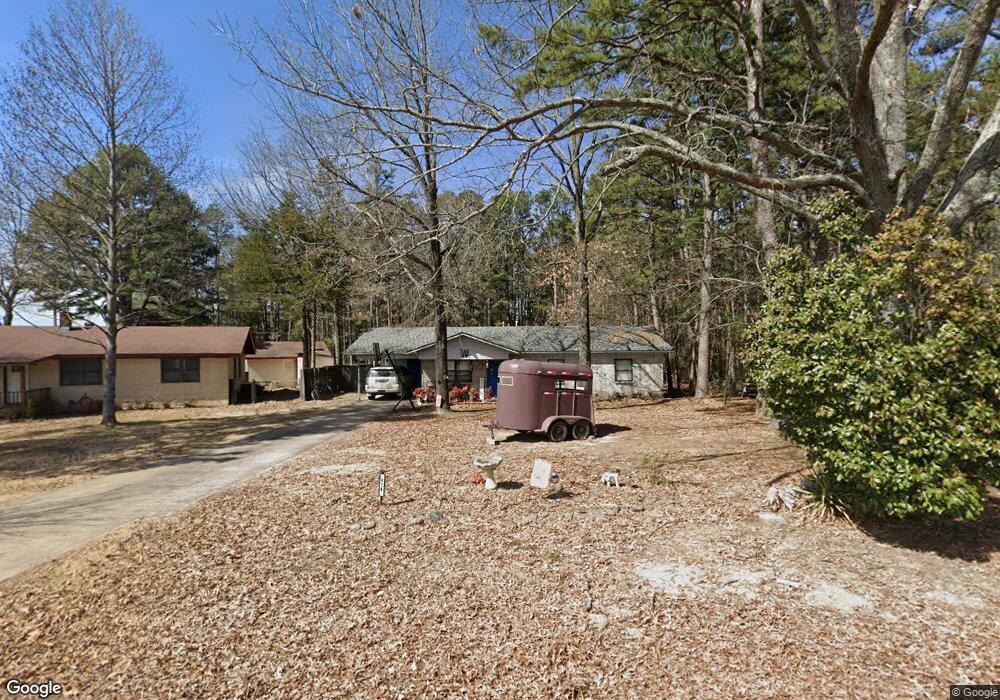
414 Atoka Dr Heber Springs, AR 72543
Estimated Value: $150,495 - $195,000
--
Bed
2
Baths
1,118
Sq Ft
$156/Sq Ft
Est. Value
About This Home
This home is located at 414 Atoka Dr, Heber Springs, AR 72543 and is currently estimated at $173,874, approximately $155 per square foot. 414 Atoka Dr is a home located in Cleburne County with nearby schools including Heber Springs Elementary School, Heber Springs Middle School, and Heber Springs High School.
Ownership History
Date
Name
Owned For
Owner Type
Purchase Details
Closed on
Mar 12, 2024
Sold by
Heigle Jeremy Shane
Bought by
Wilkerson Molly
Current Estimated Value
Purchase Details
Closed on
Jul 10, 2009
Sold by
Bartlett Jenny and Bartlett Dennis
Bought by
Wilkerson Molly
Home Financials for this Owner
Home Financials are based on the most recent Mortgage that was taken out on this home.
Original Mortgage
$86,734
Interest Rate
4.97%
Mortgage Type
New Conventional
Purchase Details
Closed on
Jan 12, 2009
Sold by
Thompson Sherry and Wilkerson Sherry T
Bought by
Bartlett Jenny
Home Financials for this Owner
Home Financials are based on the most recent Mortgage that was taken out on this home.
Original Mortgage
$55,000
Interest Rate
5.48%
Mortgage Type
Future Advance Clause Open End Mortgage
Purchase Details
Closed on
Sep 10, 1991
Bought by
Wilkerson Sherry T
Create a Home Valuation Report for This Property
The Home Valuation Report is an in-depth analysis detailing your home's value as well as a comparison with similar homes in the area
Home Values in the Area
Average Home Value in this Area
Purchase History
| Date | Buyer | Sale Price | Title Company |
|---|---|---|---|
| Wilkerson Molly | -- | None Listed On Document | |
| Wilkerson Molly | $85,000 | -- | |
| Bartlett Jenny | $55,000 | -- | |
| Wilkerson Sherry T | $7,500 | -- |
Source: Public Records
Mortgage History
| Date | Status | Borrower | Loan Amount |
|---|---|---|---|
| Previous Owner | Wilkerson Molly | $86,734 | |
| Previous Owner | Bartlett Jenny | $55,000 |
Source: Public Records
Tax History Compared to Growth
Tax History
| Year | Tax Paid | Tax Assessment Tax Assessment Total Assessment is a certain percentage of the fair market value that is determined by local assessors to be the total taxable value of land and additions on the property. | Land | Improvement |
|---|---|---|---|---|
| 2024 | $333 | $21,107 | $3,000 | $18,107 |
| 2023 | $372 | $21,107 | $3,000 | $18,107 |
| 2022 | $385 | $21,107 | $3,000 | $18,107 |
| 2021 | $349 | $16,841 | $3,000 | $13,841 |
| 2020 | $349 | $16,841 | $3,000 | $13,841 |
| 2019 | $349 | $16,841 | $3,000 | $13,841 |
| 2018 | $371 | $16,841 | $3,000 | $13,841 |
| 2017 | $712 | $16,841 | $3,000 | $13,841 |
| 2016 | $657 | $15,520 | $1,400 | $14,120 |
| 2015 | $657 | $15,520 | $1,400 | $14,120 |
| 2014 | $657 | $15,520 | $1,400 | $14,120 |
Source: Public Records
Map
Nearby Homes
- 2195 Achoma Dr
- 404 Trailwood Dr
- 2421 Hwy 25b N
- 209 Trailwood Dr
- 863 Copperfield Cove
- 1604 Ridgefield Dr
- 2255 Highway 25b
- 1401 Roe's Ridge
- 1412 Ridgefield Dr
- 2323 Pinewood Dr
- 2400 Pinewood Dr
- Lot 4 Thelma St
- 0 Woodland Bluff Dr
- Lot 16 Wisdom Pointe
- Lots 44 & 45 Lakeview Dr
- 907 Pineknot Ln
- 2002 Lakeshore Dr
- 603 Edgewater Cove
- 602 Edgewater Cove
- Lot 26 Scenic Place