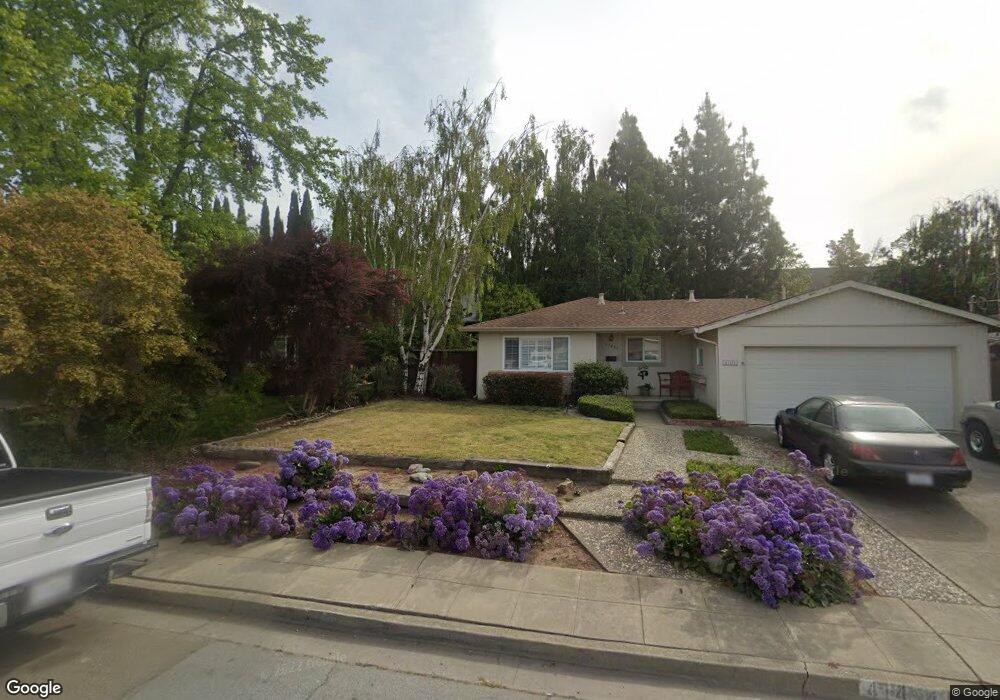
41437 Millenium Terrace Fremont, CA 94538
Irvington NeighborhoodEstimated Value: $1,047,000 - $1,190,000
3
Beds
3
Baths
1,574
Sq Ft
$724/Sq Ft
Est. Value
About This Home
This home is located at 41437 Millenium Terrace, Fremont, CA 94538 and is currently estimated at $1,139,541, approximately $723 per square foot. 41437 Millenium Terrace is a home located in Alameda County with nearby schools including O. N. Hirsch Elementary School, John M. Horner Junior High School, and Irvington High School.
Ownership History
Date
Name
Owned For
Owner Type
Purchase Details
Closed on
May 19, 2006
Sold by
Masangcay June Anthony N and Strenk Jolie
Bought by
Masangcay June Anthony N and Masangcay Jolie M
Current Estimated Value
Home Financials for this Owner
Home Financials are based on the most recent Mortgage that was taken out on this home.
Original Mortgage
$532,000
Outstanding Balance
$434,124
Interest Rate
7.12%
Mortgage Type
Negative Amortization
Estimated Equity
$705,417
Purchase Details
Closed on
Sep 19, 2002
Sold by
Trafalgar Inc
Bought by
Masangcay June Anthony N and Strenk Jolie
Home Financials for this Owner
Home Financials are based on the most recent Mortgage that was taken out on this home.
Original Mortgage
$331,040
Interest Rate
5.87%
Create a Home Valuation Report for This Property
The Home Valuation Report is an in-depth analysis detailing your home's value as well as a comparison with similar homes in the area
Home Values in the Area
Average Home Value in this Area
Purchase History
| Date | Buyer | Sale Price | Title Company |
|---|---|---|---|
| Masangcay June Anthony N | -- | Placer Title Company | |
| Masangcay June Anthony N | $481,500 | Old Republic Title Company |
Source: Public Records
Mortgage History
| Date | Status | Borrower | Loan Amount |
|---|---|---|---|
| Open | Masangcay June Anthony N | $532,000 | |
| Closed | Masangcay June Anthony N | $331,040 |
Source: Public Records
Tax History Compared to Growth
Tax History
| Year | Tax Paid | Tax Assessment Tax Assessment Total Assessment is a certain percentage of the fair market value that is determined by local assessors to be the total taxable value of land and additions on the property. | Land | Improvement |
|---|---|---|---|---|
| 2025 | $8,411 | $689,583 | $208,975 | $487,608 |
| 2024 | $8,411 | $675,928 | $204,878 | $478,050 |
| 2023 | $8,184 | $669,541 | $200,862 | $468,679 |
| 2022 | $8,075 | $649,415 | $196,924 | $459,491 |
| 2021 | $7,883 | $636,548 | $193,064 | $450,484 |
| 2020 | $7,886 | $636,954 | $191,086 | $445,868 |
| 2019 | $7,796 | $624,467 | $187,340 | $437,127 |
| 2018 | $7,643 | $612,225 | $183,667 | $428,558 |
| 2017 | $7,452 | $600,224 | $180,067 | $420,157 |
| 2016 | $7,323 | $588,460 | $176,538 | $411,922 |
| 2015 | $7,221 | $579,623 | $173,887 | $405,736 |
| 2014 | $7,103 | $568,271 | $170,481 | $397,790 |
Source: Public Records
Map
Nearby Homes
- 41212 Fremont Blvd
- 3918 Fossano Common
- 3800 Adams Ave
- 3923 Wildflower Common Unit 19
- 3872 Wildflower Common Unit 27
- 41882 Gifford St
- 4463 Hyde Common Unit 306
- 4310 Providence Terrace
- 4214 Providence Terrace
- 40708 Fremont Blvd
- 40769 Squill Common
- 3331 Union St
- 40702 Greystone Terrace Unit 9
- 4309 Bora Ave
- 40696 Robin St
- 41538 Casabella Common
- 42759 Newport Dr
- 2851 Finca Terrace
- 4533 Capewood Terrace
- 4537 Capewood Terrace
- 41433 Millenium Terrace
- 41429 Millenium Terrace
- 41340 Trenouth St
- 41441 Millenium Terrace
- 41454 Trenouth St
- 41419 Millenium Terrace
- 41445 Millenium Terrace
- 4086 Adams Ave
- 41324 Trenouth St
- 41415 Millenium Terrace
- 41449 Millenium Terrace
- 41411 Millenium Terrace
- 4062 Adams Ave
- 41453 Millenium Terrace
- 41428 Millenium Terrace
- 41466 Trenouth St
- 41407 Millenium Terrace
- 41432 Millenium Terrace
- 41308 Trenouth St
- 41436 Millenium Terrace