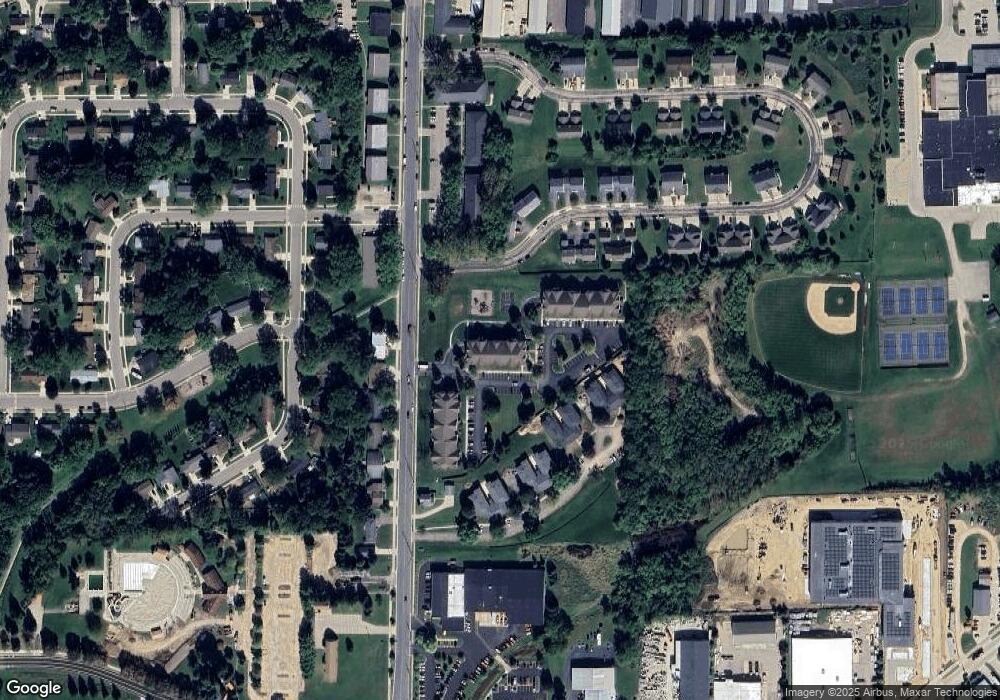
415 S Bird St Sun Prairie, WI 53590
Old Village NeighborhoodEstimated Value: $3,640,387
3
Beds
--
Bath
1,140
Sq Ft
$3,193/Sq Ft
Est. Value
About This Home
Nestled between several community parks, just Southeast of South Thompson Road, Rolling Prairie is perfectly located. Restaurants, shopping, and even a library are within a few minutes of your new home. Enjoy a controlled access building, fitness room, theater room, and playground within the Rolling Prairie community. Homes have a washer/dryer connections, kitchen pantry, and dishwasher. High speed internet is available for every home in the smoke free community.
Rolling Prairie is where is you want to relax at the end of each day.
Ownership History
Date
Name
Owned For
Owner Type
Purchase Details
Closed on
May 31, 2023
Sold by
Rolling Prairie Apartment Homes Llc
Bought by
Rolling Prairie Harmony Housing Llc
Current Estimated Value
Purchase Details
Closed on
Dec 11, 2007
Sold by
Rolling Prairie Lp I
Bought by
Rolling Prairie Apartment Homes Llc
Create a Home Valuation Report for This Property
The Home Valuation Report is an in-depth analysis detailing your home's value as well as a comparison with similar homes in the area
Home Values in the Area
Average Home Value in this Area
Purchase History
| Date | Buyer | Sale Price | Title Company |
|---|---|---|---|
| Rolling Prairie Harmony Housing Llc | $8,900,000 | None Listed On Document | |
| Rolling Prairie Apartment Homes Llc | $2,052,000 | None Available |
Source: Public Records
Property History
| Date | Event | Price | List to Sale | Price per Sq Ft |
|---|---|---|---|---|
| 06/04/2025 06/04/25 | Off Market | $1,750 | -- | -- |
| 04/04/2025 04/04/25 | Price Changed | $1,750 | +23.1% | $2 / Sq Ft |
| 01/30/2025 01/30/25 | Price Changed | $1,422 | +10.1% | $1 / Sq Ft |
| 05/23/2024 05/23/24 | For Rent | $1,292 | -- | -- |
Tax History Compared to Growth
Tax History
| Year | Tax Paid | Tax Assessment Tax Assessment Total Assessment is a certain percentage of the fair market value that is determined by local assessors to be the total taxable value of land and additions on the property. | Land | Improvement |
|---|---|---|---|---|
| 2024 | $5,302 | -- | -- | -- |
| 2023 | $92,570 | $5,213,900 | $648,000 | $4,565,900 |
| 2021 | $60,628 | $2,747,800 | $388,800 | $2,359,000 |
| 2020 | $60,378 | $2,747,800 | $388,800 | $2,359,000 |
| 2019 | $50,647 | $2,035,200 | $386,700 | $1,648,500 |
| 2018 | $46,548 | $2,035,200 | $386,700 | $1,648,500 |
| 2017 | $44,263 | $2,035,200 | $386,700 | $1,648,500 |
| 2016 | $43,493 | $1,807,900 | $367,200 | $1,440,700 |
| 2015 | $42,164 | $1,807,900 | $367,200 | $1,440,700 |
| 2014 | $42,155 | $1,792,800 | $367,200 | $1,425,600 |
| 2013 | $37,975 | $1,792,800 | $367,200 | $1,425,600 |
Source: Public Records
Map
Nearby Homes
- 600 Linnerud Dr
- 709 Linnerud Dr
- 916 Ring St
- 1033 Lothe St
- 200 Queens St
- 530 W Main St
- 147 Flint St
- 1443 Buena Vista Dr
- 1402 Andaman St
- 1486 Ivory Dr
- 3345 U S 151
- 924 Walker Ct
- 201 E Lane St Unit 202
- 2543 Water Lily Cir
- 2560 Water Lily Cir
- 2535 Water Lily Cir
- 2522 Water Lily Cir
- 227 Windsor St
- 903 Clarmar Dr
- 706 Woodland Dr
