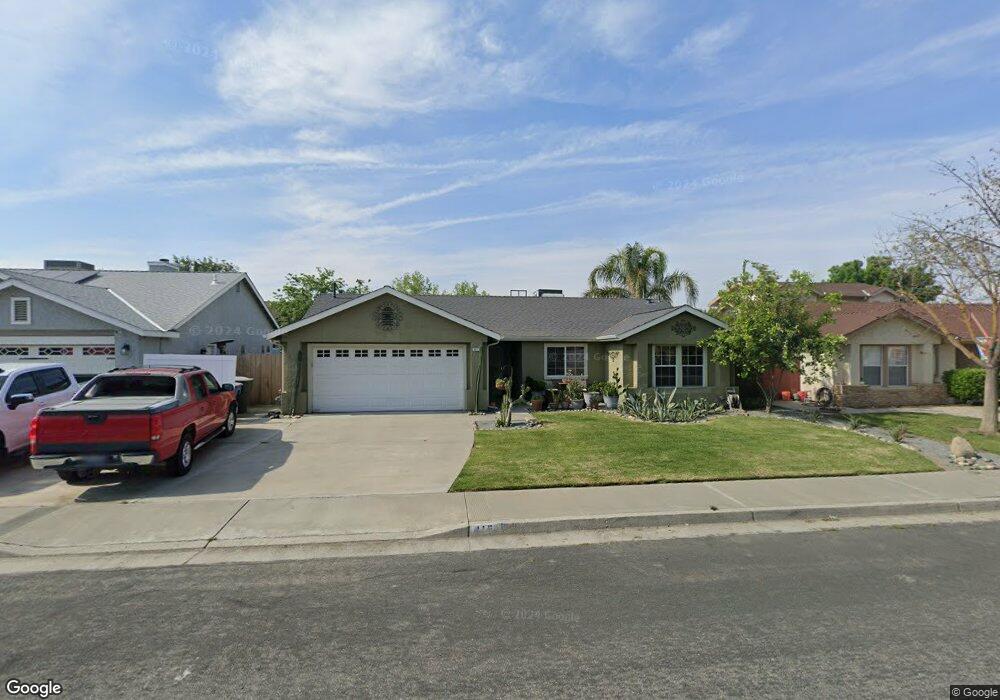
415 W Windsor Dr Hanford, CA 93230
Estimated Value: $337,000 - $375,000
3
Beds
2
Baths
1,250
Sq Ft
$285/Sq Ft
Est. Value
About This Home
This home is located at 415 W Windsor Dr, Hanford, CA 93230 and is currently estimated at $355,913, approximately $284 per square foot. 415 W Windsor Dr is a home located in Kings County with nearby schools including Hanford West High School, Pioneer Elementary School, and Pioneer Middle School.
Ownership History
Date
Name
Owned For
Owner Type
Purchase Details
Closed on
May 25, 2017
Sold by
Alves Steven J
Bought by
Alves Steven J and Alves Victoria L
Current Estimated Value
Home Financials for this Owner
Home Financials are based on the most recent Mortgage that was taken out on this home.
Original Mortgage
$75,000
Outstanding Balance
$62,148
Interest Rate
3.97%
Mortgage Type
Credit Line Revolving
Estimated Equity
$293,765
Purchase Details
Closed on
Nov 6, 2000
Sold by
Green Jeffrey P and Green Jolene
Bought by
Alves Steven J
Purchase Details
Closed on
Dec 23, 1998
Sold by
Green Jeffrey Paul and Green Jolene Shari
Bought by
Green Jeffrey P and Green Jolene
Home Financials for this Owner
Home Financials are based on the most recent Mortgage that was taken out on this home.
Original Mortgage
$95,942
Interest Rate
6.82%
Mortgage Type
FHA
Create a Home Valuation Report for This Property
The Home Valuation Report is an in-depth analysis detailing your home's value as well as a comparison with similar homes in the area
Home Values in the Area
Average Home Value in this Area
Purchase History
| Date | Buyer | Sale Price | Title Company |
|---|---|---|---|
| Alves Steven J | -- | Chicago Title Company | |
| Alves Steven J | $17,000 | Hanford Title Co | |
| Green Jeffrey P | -- | First American Title Co |
Source: Public Records
Mortgage History
| Date | Status | Borrower | Loan Amount |
|---|---|---|---|
| Open | Alves Steven J | $75,000 | |
| Previous Owner | Green Jeffrey P | $95,942 |
Source: Public Records
Tax History Compared to Growth
Tax History
| Year | Tax Paid | Tax Assessment Tax Assessment Total Assessment is a certain percentage of the fair market value that is determined by local assessors to be the total taxable value of land and additions on the property. | Land | Improvement |
|---|---|---|---|---|
| 2025 | $1,784 | $167,468 | $49,720 | $117,748 |
| 2023 | $1,784 | $160,968 | $47,791 | $113,177 |
| 2022 | $1,727 | $157,812 | $46,854 | $110,958 |
| 2021 | $1,696 | $154,719 | $45,936 | $108,783 |
| 2020 | $1,699 | $153,133 | $45,465 | $107,668 |
| 2019 | $1,672 | $150,131 | $44,574 | $105,557 |
| 2018 | $1,661 | $147,187 | $43,700 | $103,487 |
| 2017 | $1,631 | $144,301 | $42,843 | $101,458 |
| 2016 | $1,546 | $141,472 | $42,003 | $99,469 |
| 2015 | $1,498 | $139,347 | $41,372 | $97,975 |
| 2014 | $1,508 | $136,618 | $40,562 | $96,056 |
Source: Public Records
Map
Nearby Homes