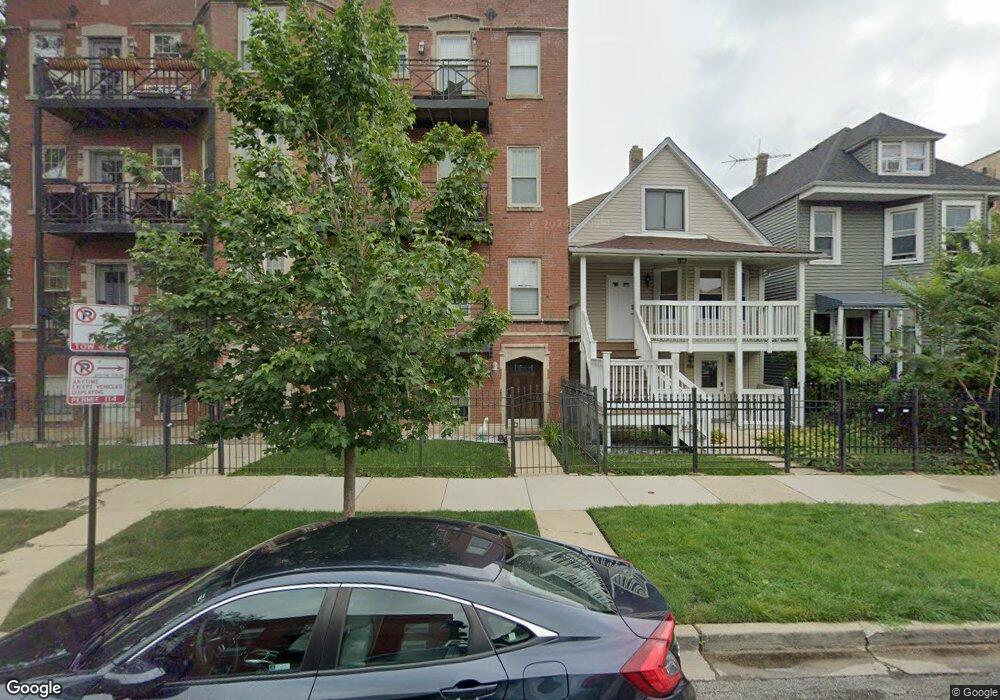
4155 N Bernard St Unit 4155G Chicago, IL 60618
Irving Park NeighborhoodEstimated Value: $128,000 - $138,062
1
Bed
1
Bath
18,000
Sq Ft
$7/Sq Ft
Est. Value
About This Home
This home is located at 4155 N Bernard St Unit 4155G, Chicago, IL 60618 and is currently estimated at $134,516, approximately $7 per square foot. 4155 N Bernard St Unit 4155G is a home located in Cook County with nearby schools including Henry Elementary School, Roosevelt High School, and CICS Irving Park.
Ownership History
Date
Name
Owned For
Owner Type
Purchase Details
Closed on
Oct 14, 2021
Sold by
Colon Jesus A
Bought by
Kessler John
Current Estimated Value
Home Financials for this Owner
Home Financials are based on the most recent Mortgage that was taken out on this home.
Original Mortgage
$66,500
Outstanding Balance
$61,129
Interest Rate
3.37%
Mortgage Type
New Conventional
Estimated Equity
$73,387
Purchase Details
Closed on
Jul 7, 2004
Sold by
4155 Bernard Llc
Bought by
Colon Jesus A
Purchase Details
Closed on
May 14, 2001
Sold by
Buitron Lidia M
Bought by
Ybarra Ruben
Home Financials for this Owner
Home Financials are based on the most recent Mortgage that was taken out on this home.
Original Mortgage
$420,000
Interest Rate
7.5%
Purchase Details
Closed on
Oct 3, 1997
Sold by
Quilaton Mauro B and Quilaton Lorenza M
Bought by
Buitron Lidia M
Home Financials for this Owner
Home Financials are based on the most recent Mortgage that was taken out on this home.
Original Mortgage
$302,400
Interest Rate
8.37%
Create a Home Valuation Report for This Property
The Home Valuation Report is an in-depth analysis detailing your home's value as well as a comparison with similar homes in the area
Home Values in the Area
Average Home Value in this Area
Purchase History
| Date | Buyer | Sale Price | Title Company |
|---|---|---|---|
| Kessler John | $95,000 | Heritage Title Company | |
| Colon Jesus A | $147,000 | Git | |
| Ybarra Ruben | $560,000 | -- | |
| Buitron Lidia M | $252,000 | -- |
Source: Public Records
Mortgage History
| Date | Status | Borrower | Loan Amount |
|---|---|---|---|
| Open | Kessler John | $66,500 | |
| Previous Owner | Ybarra Ruben | $420,000 | |
| Previous Owner | Buitron Lidia M | $302,400 |
Source: Public Records
Tax History Compared to Growth
Tax History
| Year | Tax Paid | Tax Assessment Tax Assessment Total Assessment is a certain percentage of the fair market value that is determined by local assessors to be the total taxable value of land and additions on the property. | Land | Improvement |
|---|---|---|---|---|
| 2024 | $2,879 | $14,654 | $1,680 | $12,974 |
| 2023 | $2,807 | $13,600 | $1,355 | $12,245 |
| 2022 | $2,807 | $13,600 | $1,355 | $12,245 |
| 2021 | $2,743 | $13,598 | $1,354 | $12,244 |
| 2020 | $2,417 | $10,812 | $596 | $10,216 |
| 2019 | $2,427 | $12,040 | $596 | $11,444 |
| 2018 | $2,386 | $12,040 | $596 | $11,444 |
| 2017 | $2,546 | $11,789 | $541 | $11,248 |
| 2016 | $2,369 | $11,789 | $541 | $11,248 |
| 2015 | $2,382 | $12,955 | $541 | $12,414 |
| 2014 | $2,447 | $13,140 | $487 | $12,653 |
| 2013 | $2,399 | $13,140 | $487 | $12,653 |
Source: Public Records
Map
Nearby Homes
- 4155 N Bernard St Unit G
- 4246 N Kimball Ave
- 4143 N Drake Ave
- 4207 N Drake Ave
- 4026 N Kimball Ave
- 4322 N Kimball Ave
- 3247 W Berteau Ave
- 3558 W Belle Plaine Ave Unit 3
- 4249 N Central Park Ave
- 3551 W Belle Plaine Ave Unit 2
- 4248 N Sawyer Ave
- 3222 W Berteau Ave Unit 2
- 3223 W Belle Plaine Ave
- 4116 N Kedzie Ave
- 3940 N Christiana Ave
- 3923 N Bernard St
- 3925 N Saint Louis Ave
- 4231 N Kedzie Ave Unit 3E
- 4231 N Kedzie Ave Unit 4C
- 4103 N Lawndale Ave Unit 202
- 4157 N Bernard St Unit 4157G
- 4157 N Bernard St Unit 41572
- 3425 W Berteau Ave Unit 34251
- 3419 W Berteau Ave Unit 34191
- 4155 N Bernard St Unit 41551
- 4155 N Bernard St Unit 41552
- 3425 W Berteau Ave Unit 34252
- 3415 W Berteau Ave Unit 34152
- 3415 W Berteau Ave Unit 34153
- 3425 W Berteau Ave Unit 34253
- 3419 W Berteau Ave Unit 34193
- 4157 N Bernard St Unit 41571
- 4155 N Bernard St Unit 41553
- 3419 W Berteau Ave Unit 34192
- 3415 W Berteau Ave Unit 34151
- 3415 W Berteau Ave Unit 3415G
- 4157 N Bernard St Unit 41573
- 3415 W Berteau Ave Unit 3
- 4155 N Bernard St Unit 2
- 3415 W Berteau Ave Unit 2