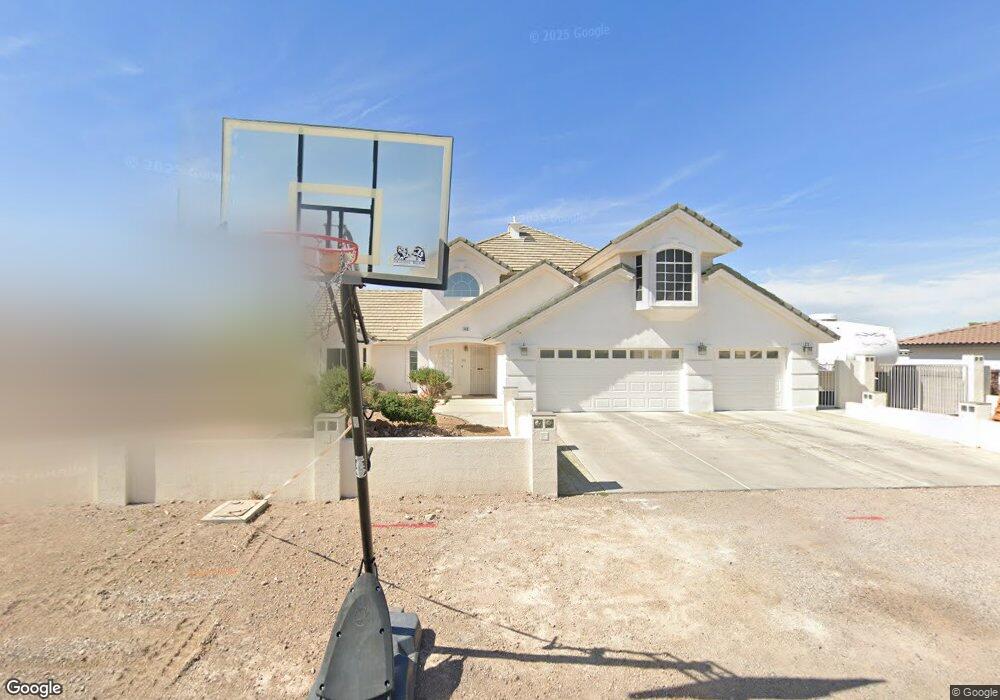
416 Kiel St Henderson, NV 89015
Foothills NeighborhoodEstimated Value: $620,175 - $798,000
4
Beds
3
Baths
2,315
Sq Ft
$314/Sq Ft
Est. Value
About This Home
This home is located at 416 Kiel St, Henderson, NV 89015 and is currently estimated at $726,294, approximately $313 per square foot. 416 Kiel St is a home located in Clark County with nearby schools including C T Sewell Elementary School, B Mahlon Brown Academy of International Studies, and Basic Academy of International Studies.
Ownership History
Date
Name
Owned For
Owner Type
Purchase Details
Closed on
Feb 13, 2024
Sold by
Mcspadden Sharon K
Bought by
Sharon Kimi Mcspadden Living Trust and Mcspadden
Current Estimated Value
Purchase Details
Closed on
Jun 4, 1996
Sold by
Starr Dale
Bought by
Mcspadden Jerry D and Mcspadden Sharon K
Home Financials for this Owner
Home Financials are based on the most recent Mortgage that was taken out on this home.
Original Mortgage
$21,000
Interest Rate
8.09%
Create a Home Valuation Report for This Property
The Home Valuation Report is an in-depth analysis detailing your home's value as well as a comparison with similar homes in the area
Home Values in the Area
Average Home Value in this Area
Purchase History
| Date | Buyer | Sale Price | Title Company |
|---|---|---|---|
| Sharon Kimi Mcspadden Living Trust | -- | None Listed On Document | |
| Mcspadden Jerry D | $38,000 | Nevada Title Company |
Source: Public Records
Mortgage History
| Date | Status | Borrower | Loan Amount |
|---|---|---|---|
| Previous Owner | Mcspadden Jerry D | $21,000 |
Source: Public Records
Tax History Compared to Growth
Tax History
| Year | Tax Paid | Tax Assessment Tax Assessment Total Assessment is a certain percentage of the fair market value that is determined by local assessors to be the total taxable value of land and additions on the property. | Land | Improvement |
|---|---|---|---|---|
| 2025 | $2,506 | $135,859 | $52,500 | $83,359 |
| 2024 | $2,434 | $135,859 | $52,500 | $83,359 |
| 2023 | $2,434 | $131,338 | $52,500 | $78,838 |
| 2022 | $2,477 | $117,625 | $45,500 | $72,125 |
| 2021 | $2,251 | $110,756 | $42,000 | $68,756 |
| 2020 | $2,085 | $110,103 | $42,000 | $68,103 |
| 2019 | $1,994 | $98,779 | $31,500 | $67,279 |
| 2018 | $1,902 | $85,750 | $21,000 | $64,750 |
| 2017 | $2,479 | $86,839 | $21,000 | $65,839 |
| 2016 | $1,744 | $84,493 | $21,000 | $63,493 |
| 2015 | $1,777 | $72,995 | $14,000 | $58,995 |
| 2014 | $1,725 | $63,173 | $14,000 | $49,173 |
Source: Public Records
Map
Nearby Homes