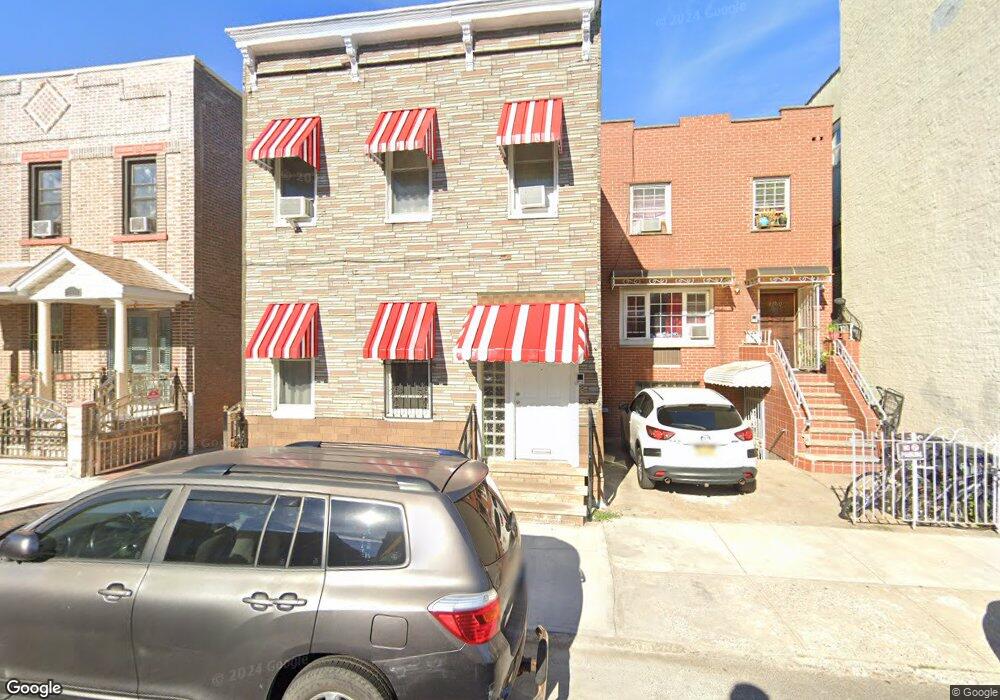
4160 54th St Woodside, NY 11377
Woodside NeighborhoodEstimated Value: $1,017,041 - $1,305,000
--
Bed
--
Bath
1,960
Sq Ft
$604/Sq Ft
Est. Value
About This Home
This home is located at 4160 54th St, Woodside, NY 11377 and is currently estimated at $1,183,010, approximately $603 per square foot. 4160 54th St is a home located in Queens County with nearby schools including P.S. 11 Kathryn Phelan, William Cullen Bryant High School, and Razi School.
Ownership History
Date
Name
Owned For
Owner Type
Purchase Details
Closed on
Oct 19, 2007
Sold by
Kamal Helena
Bought by
Chen Fu Sheng and Chen Gui Hua
Current Estimated Value
Home Financials for this Owner
Home Financials are based on the most recent Mortgage that was taken out on this home.
Original Mortgage
$531,000
Outstanding Balance
$333,772
Interest Rate
6.43%
Mortgage Type
Purchase Money Mortgage
Estimated Equity
$849,238
Purchase Details
Closed on
Apr 28, 2006
Sold by
Kohlbecker Roger and Kohlbecker Vivian
Bought by
Kamal Helena
Home Financials for this Owner
Home Financials are based on the most recent Mortgage that was taken out on this home.
Original Mortgage
$316,000
Interest Rate
6.62%
Mortgage Type
Purchase Money Mortgage
Purchase Details
Closed on
Jun 23, 2004
Sold by
Gohrig Ignaz
Bought by
Kohlbecker Roger and Kohlbecker Vivian
Create a Home Valuation Report for This Property
The Home Valuation Report is an in-depth analysis detailing your home's value as well as a comparison with similar homes in the area
Home Values in the Area
Average Home Value in this Area
Purchase History
| Date | Buyer | Sale Price | Title Company |
|---|---|---|---|
| Chen Fu Sheng | $708,000 | -- | |
| Chen Fu Sheng | $708,000 | -- | |
| Kamal Helena | $395,000 | -- | |
| Kamal Helena | $395,000 | -- | |
| Kohlbecker Roger | $265,000 | -- | |
| Kohlbecker Roger | $265,000 | -- |
Source: Public Records
Mortgage History
| Date | Status | Borrower | Loan Amount |
|---|---|---|---|
| Open | Chen Fu Sheng | $531,000 | |
| Closed | Chen Fu Sheng | $531,000 | |
| Previous Owner | Kamal Helena | $316,000 |
Source: Public Records
Tax History Compared to Growth
Tax History
| Year | Tax Paid | Tax Assessment Tax Assessment Total Assessment is a certain percentage of the fair market value that is determined by local assessors to be the total taxable value of land and additions on the property. | Land | Improvement |
|---|---|---|---|---|
| 2025 | $7,285 | $37,994 | $9,608 | $28,386 |
| 2024 | $7,285 | $36,269 | $10,053 | $26,216 |
| 2023 | $6,872 | $34,217 | $8,813 | $25,404 |
| 2022 | $6,444 | $72,060 | $18,360 | $53,700 |
| 2021 | $6,793 | $67,800 | $18,360 | $49,440 |
| 2020 | $6,702 | $64,740 | $18,360 | $46,380 |
| 2019 | $6,323 | $71,220 | $18,360 | $52,860 |
| 2018 | $5,813 | $28,514 | $8,822 | $19,692 |
| 2017 | $5,484 | $26,900 | $10,225 | $16,675 |
| 2016 | $5,378 | $26,900 | $10,225 | $16,675 |
| 2015 | $3,061 | $26,385 | $15,991 | $10,394 |
| 2014 | $3,061 | $25,187 | $12,975 | $12,212 |
Source: Public Records
Map
Nearby Homes
- 41-53 53rd St
- 4153 53rd St
- 52-16 Roosevelt Ave Unit 2A
- 5216 Roosevelt Ave Unit 3A
- 5216 Roosevelt Ave Unit 5A
- 41-32 53rd St
- 41-25 53rd St
- 43-30 52nd St Unit 2A
- 43-30 52nd St Unit 3B
- 4315 54th St
- 43-06 55th St
- 4330 52nd St Unit 4A
- 41-31 51st St Unit 7M
- 41-31 51st St Unit 6M
- 5005 43rd Ave Unit 5H
- 52-30 39th Dr Unit 6S
- 52-30 39th Dr Unit LN
- 52-30 39th Dr Unit 7F
- 52-30 39th Dr Unit 9B
- 52-30 39th Dr Unit 3V
- 4162 54th St
- 41-56 54th St Unit 4
- 41-56 54th St Unit 9
- 41-56 54th St
- 4156 54th St
- 4164 54th St
- 41-64 54th St Unit FL2
- 41-64 54th St
- 41-54 54th St
- 4154 54th St
- 4168 54th St
- 4152 54th St
- 41-52 54th St Unit 1
- 4152 54th St
- 4152 54th St Unit 1
- 41-52 54th St
- 4168 54th St
- 41-63 53rd St Unit 1-FL
- 41-63 53rd St Unit 3-FLR
- 41-61 53rd St