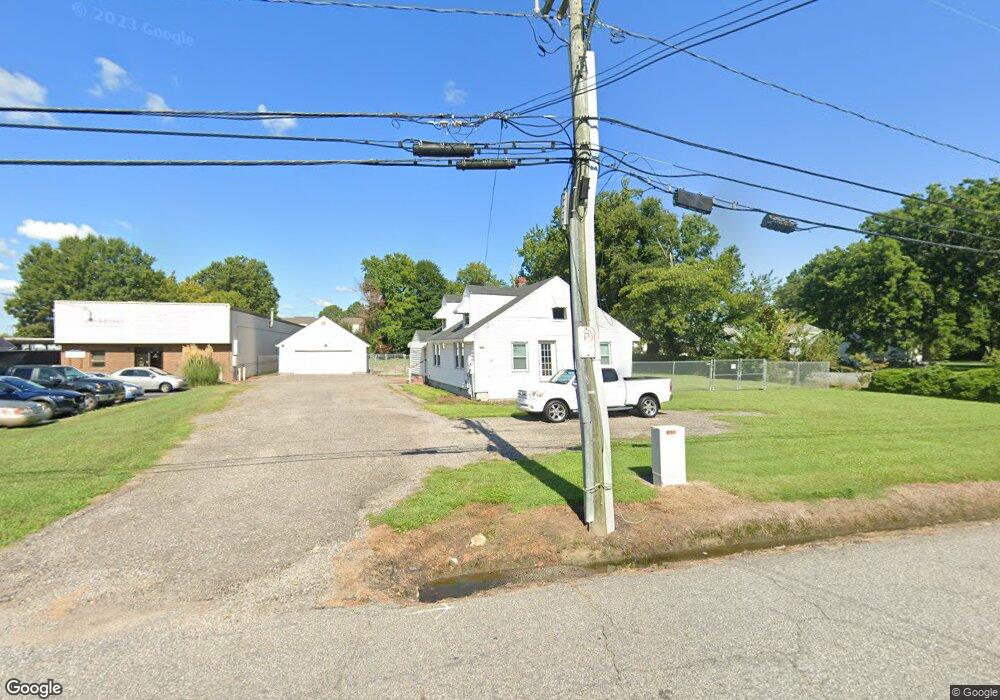
417 Davis St Virginia Beach, VA 23462
Bayside NeighborhoodEstimated Value: $394,000 - $566,000
4
Beds
1
Bath
1,906
Sq Ft
$260/Sq Ft
Est. Value
About This Home
This home is located at 417 Davis St, Virginia Beach, VA 23462 and is currently estimated at $496,270, approximately $260 per square foot. 417 Davis St is a home located in Virginia Beach City with nearby schools including Bettie F. Williams Elementary, Newtown Elementary School, and Diamond Springs Elementary School.
Ownership History
Date
Name
Owned For
Owner Type
Purchase Details
Closed on
May 22, 2018
Sold by
Anderson Arvil and Anderson Loreen Marie
Bought by
Davis Street Investments Llc
Current Estimated Value
Purchase Details
Closed on
Aug 1, 2003
Sold by
Hammitt Thelma Louise
Bought by
Anderson Arvil E
Home Financials for this Owner
Home Financials are based on the most recent Mortgage that was taken out on this home.
Original Mortgage
$100,000
Interest Rate
5.86%
Mortgage Type
Construction
Create a Home Valuation Report for This Property
The Home Valuation Report is an in-depth analysis detailing your home's value as well as a comparison with similar homes in the area
Home Values in the Area
Average Home Value in this Area
Purchase History
| Date | Buyer | Sale Price | Title Company |
|---|---|---|---|
| Davis Street Investments Llc | $290,000 | Attorney | |
| Anderson Arvil E | $189,900 | -- |
Source: Public Records
Mortgage History
| Date | Status | Borrower | Loan Amount |
|---|---|---|---|
| Previous Owner | Anderson Arvil E | $100,000 |
Source: Public Records
Tax History Compared to Growth
Tax History
| Year | Tax Paid | Tax Assessment Tax Assessment Total Assessment is a certain percentage of the fair market value that is determined by local assessors to be the total taxable value of land and additions on the property. | Land | Improvement |
|---|---|---|---|---|
| 2025 | $5,415 | $580,400 | $509,800 | $70,600 |
| 2024 | $5,415 | $558,200 | $487,600 | $70,600 |
| 2023 | $5,531 | $558,700 | $487,600 | $71,100 |
| 2022 | $5,535 | $559,100 | $487,600 | $71,500 |
| 2021 | $5,542 | $559,800 | $487,600 | $72,200 |
| 2020 | $5,699 | $560,100 | $487,600 | $72,500 |
| 2019 | $5,701 | $472,100 | $399,000 | $73,100 |
| 2018 | $4,733 | $472,100 | $399,000 | $73,100 |
| 2017 | $4,736 | $472,400 | $399,000 | $73,400 |
| 2016 | $4,754 | $480,200 | $399,000 | $81,200 |
| 2015 | $6,619 | $425,300 | $343,600 | $81,700 |
| 2014 | $3,287 | $367,200 | $285,500 | $81,700 |
Source: Public Records
Map
Nearby Homes
- 5600 Landfall Dr Unit 102
- 513 Wharf Ct
- 515 Wharf Ct
- 507 Wharf Ct
- 622 Crows Nest Ct
- 5682 Landfall Dr
- 506 Pillar Ct Unit 201
- 543 Landfall Arch
- 5661 Summit Arch
- 610 Pylon Ct
- 492 Baker Rd
- 661 Aubrey Dr
- 510 Summit Ct
- 5624 Summit Arch
- 716 Aylesbury Dr Unit X1705
- 661 Revival Ln
- 279 Fair Meadows Rd
- 644 Lawrence Dr
- 505 Liberty Ct
- 5621 Elam Ave