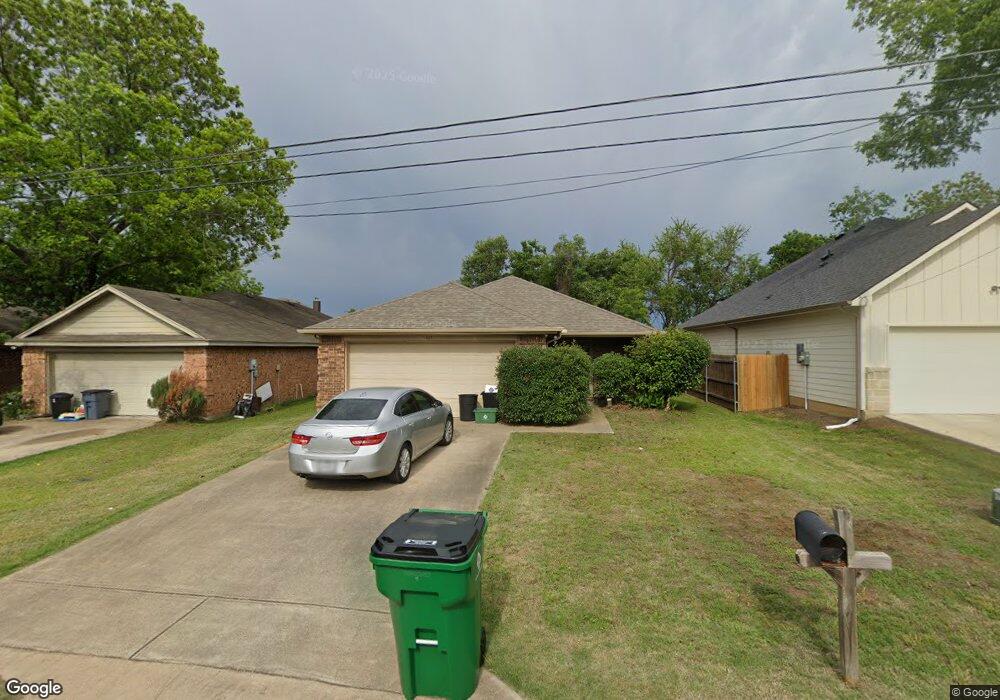
417 Grayson Ct Joshua, TX 76058
Estimated Value: $271,000 - $289,000
3
Beds
2
Baths
1,540
Sq Ft
$181/Sq Ft
Est. Value
About This Home
This home is located at 417 Grayson Ct, Joshua, TX 76058 and is currently estimated at $278,583, approximately $180 per square foot. 417 Grayson Ct is a home located in Johnson County with nearby schools including H.D. Staples Elementary School, R C Loflin Middle School, and Joshua High School.
Ownership History
Date
Name
Owned For
Owner Type
Purchase Details
Closed on
Nov 17, 2010
Sold by
Stock Loan Services Llc
Bought by
Wolinski Clarence J
Current Estimated Value
Home Financials for this Owner
Home Financials are based on the most recent Mortgage that was taken out on this home.
Original Mortgage
$80,466
Outstanding Balance
$52,819
Interest Rate
4.17%
Mortgage Type
New Conventional
Estimated Equity
$225,764
Purchase Details
Closed on
Aug 8, 2006
Sold by
Jabez Development Lp
Bought by
Hmh Lifestyles Lp
Create a Home Valuation Report for This Property
The Home Valuation Report is an in-depth analysis detailing your home's value as well as a comparison with similar homes in the area
Home Values in the Area
Average Home Value in this Area
Purchase History
| Date | Buyer | Sale Price | Title Company |
|---|---|---|---|
| Wolinski Clarence J | -- | None Available | |
| Hmh Lifestyles Lp | -- | Stnt |
Source: Public Records
Mortgage History
| Date | Status | Borrower | Loan Amount |
|---|---|---|---|
| Open | Wolinski Clarence J | $80,466 |
Source: Public Records
Tax History Compared to Growth
Tax History
| Year | Tax Paid | Tax Assessment Tax Assessment Total Assessment is a certain percentage of the fair market value that is determined by local assessors to be the total taxable value of land and additions on the property. | Land | Improvement |
|---|---|---|---|---|
| 2025 | $3,682 | $276,763 | $40,000 | $236,763 |
| 2024 | $5,132 | $210,851 | $0 | $0 |
| 2023 | $3,026 | $262,325 | $40,000 | $222,325 |
| 2022 | $4,372 | $242,113 | $40,000 | $202,113 |
| 2021 | $4,010 | $168,304 | $15,000 | $153,304 |
| 2020 | $3,943 | $160,018 | $15,000 | $145,018 |
| 2019 | $3,766 | $143,444 | $15,000 | $128,444 |
| 2018 | $3,519 | $139,301 | $15,000 | $124,301 |
| 2017 | $3,197 | $118,585 | $15,000 | $103,585 |
| 2016 | $2,907 | $114,441 | $15,000 | $99,441 |
| 2015 | $1,953 | $97,867 | $15,000 | $82,867 |
| 2014 | $1,953 | $81,293 | $15,000 | $66,293 |
Source: Public Records
Map
Nearby Homes