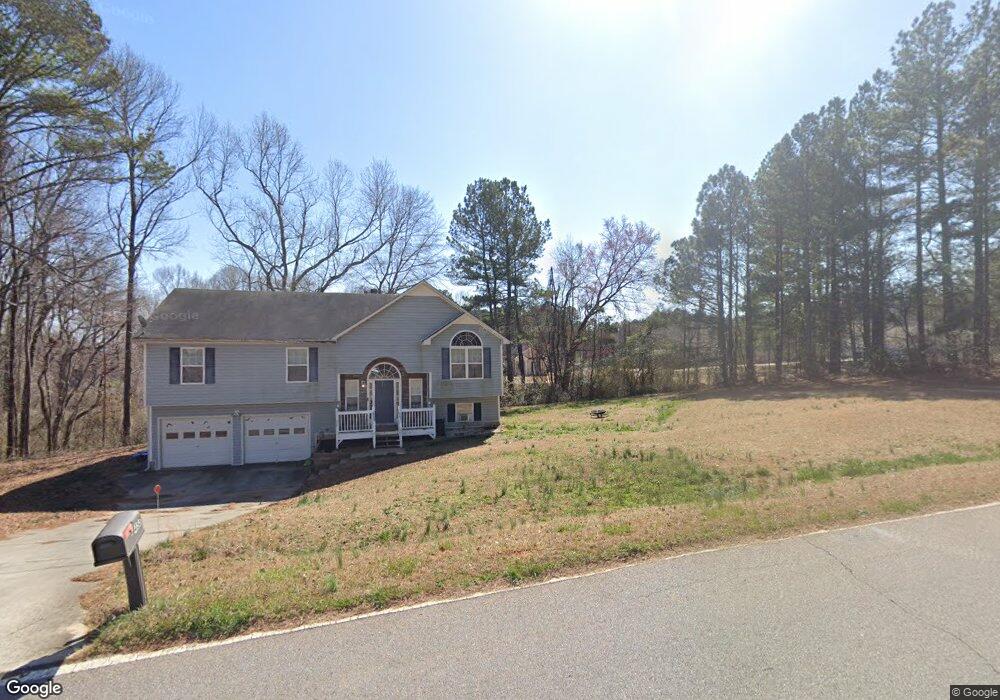
417 Ledbetter Rd Villa Rica, GA 30180
Estimated Value: $312,922 - $319,000
3
Beds
2
Baths
1,697
Sq Ft
$186/Sq Ft
Est. Value
About This Home
This home is located at 417 Ledbetter Rd, Villa Rica, GA 30180 and is currently estimated at $316,481, approximately $186 per square foot. 417 Ledbetter Rd is a home located in Carroll County with nearby schools including Glanton-Hindsman Elementary School, Villa Rica Middle School, and Villa Rica High School.
Ownership History
Date
Name
Owned For
Owner Type
Purchase Details
Closed on
Nov 21, 2018
Sold by
Smith James D
Bought by
Smith James D
Current Estimated Value
Purchase Details
Closed on
Nov 3, 2009
Sold by
Parramore Michael H
Bought by
Suntrust Mortgage Inc
Purchase Details
Closed on
Jun 27, 2005
Sold by
Bedrock Construction Inc
Bought by
Parramore Michael H
Home Financials for this Owner
Home Financials are based on the most recent Mortgage that was taken out on this home.
Original Mortgage
$138,613
Interest Rate
5.57%
Mortgage Type
New Conventional
Purchase Details
Closed on
Apr 22, 2005
Sold by
Bowling Kenneth A
Bought by
Bedrock Const Inc
Home Financials for this Owner
Home Financials are based on the most recent Mortgage that was taken out on this home.
Original Mortgage
$114,000
Interest Rate
5.99%
Mortgage Type
New Conventional
Create a Home Valuation Report for This Property
The Home Valuation Report is an in-depth analysis detailing your home's value as well as a comparison with similar homes in the area
Home Values in the Area
Average Home Value in this Area
Purchase History
| Date | Buyer | Sale Price | Title Company |
|---|---|---|---|
| Smith James D | -- | -- | |
| Suntrust Mortgage Inc | -- | -- | |
| Parramore Michael H | $142,900 | -- | |
| Bedrock Const Inc | $13,000 | -- |
Source: Public Records
Mortgage History
| Date | Status | Borrower | Loan Amount |
|---|---|---|---|
| Previous Owner | Parramore Michael H | $138,613 | |
| Previous Owner | Bedrock Const Inc | $114,000 |
Source: Public Records
Tax History Compared to Growth
Tax History
| Year | Tax Paid | Tax Assessment Tax Assessment Total Assessment is a certain percentage of the fair market value that is determined by local assessors to be the total taxable value of land and additions on the property. | Land | Improvement |
|---|---|---|---|---|
| 2024 | $2,282 | $125,689 | $5,196 | $120,493 |
| 2023 | $2,282 | $114,504 | $4,158 | $110,346 |
| 2022 | $1,890 | $91,311 | $2,772 | $88,539 |
| 2021 | $1,716 | $79,097 | $2,217 | $76,880 |
| 2020 | $1,541 | $69,276 | $2,016 | $67,260 |
| 2019 | $1,461 | $64,250 | $2,016 | $62,234 |
| 2018 | $1,341 | $56,610 | $1,884 | $54,726 |
| 2017 | $1,345 | $56,610 | $1,884 | $54,726 |
| 2016 | $1,346 | $56,610 | $1,884 | $54,726 |
| 2015 | $1,335 | $51,736 | $8,000 | $43,736 |
| 2014 | $1,341 | $51,736 | $8,000 | $43,736 |
Source: Public Records
Map
Nearby Homes
- 413 Ledbetter Rd
- 409 Ledbetter Rd
- 433 Ledbetter Rd
- 123 Amidon Dr
- 405 Ledbetter Rd
- 127 Amidon Dr
- 302 Blackfoot Trail
- 439 Ledbetter Rd
- 315 Indian Lake Trail
- 353 Indian Lake Trail
- 351 Indian Lake Trail
- 343 Indian Lake Trail
- 341 Indian Lake Trail
- 315 Indian Lake Trail Unit 155
- 131 Amidon Dr
- 122 Amidon Dr
- 203 Emily Cir
- 111 Amidon Dr
- 207 Emily Cir
- 128 Amidon Dr