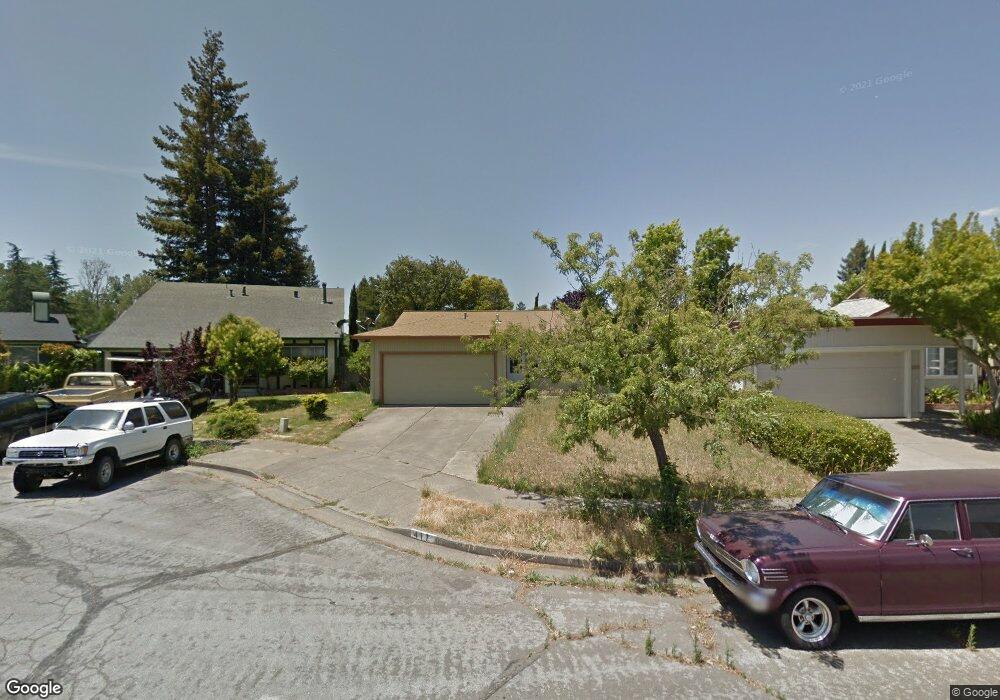
417 Saint Mary Place Santa Rosa, CA 95409
Estimated Value: $551,426 - $686,000
2
Beds
1
Bath
928
Sq Ft
$663/Sq Ft
Est. Value
About This Home
This home is located at 417 Saint Mary Place, Santa Rosa, CA 95409 and is currently estimated at $615,357, approximately $663 per square foot. 417 Saint Mary Place is a home located in Sonoma County with nearby schools including Rincon Valley Middle School, Maria Carrillo High School, and Binkley Elementary Charter School.
Ownership History
Date
Name
Owned For
Owner Type
Purchase Details
Closed on
Jul 12, 2016
Sold by
Roberts Cagle Sharon J
Bought by
Abbott Matthew and Mcdonald Abbott Anthea
Current Estimated Value
Home Financials for this Owner
Home Financials are based on the most recent Mortgage that was taken out on this home.
Original Mortgage
$362,700
Outstanding Balance
$290,288
Interest Rate
3.66%
Mortgage Type
New Conventional
Estimated Equity
$325,069
Purchase Details
Closed on
Jul 7, 2014
Sold by
Cagle Steven T and Roberts Cagle Sharon J
Bought by
Roberts Cagle Sharon J
Purchase Details
Closed on
May 22, 1996
Sold by
Cagle Steven T
Bought by
Cagle Steven T and Roberts Cagle Sharon J
Purchase Details
Closed on
Mar 7, 1994
Sold by
Cagle Sharon
Bought by
Cagle Steven T
Home Financials for this Owner
Home Financials are based on the most recent Mortgage that was taken out on this home.
Original Mortgage
$147,250
Interest Rate
3.75%
Create a Home Valuation Report for This Property
The Home Valuation Report is an in-depth analysis detailing your home's value as well as a comparison with similar homes in the area
Home Values in the Area
Average Home Value in this Area
Purchase History
| Date | Buyer | Sale Price | Title Company |
|---|---|---|---|
| Abbott Matthew | $403,000 | Fidelity National Title Co | |
| Roberts Cagle Sharon J | -- | None Available | |
| Cagle Steven T | -- | -- | |
| Cagle Steven T | -- | Old Republic Title Company | |
| Cagle Steven T | $155,000 | Old Republic Title Company | |
| Shubin Robert J | -- | Old Republic Title Company |
Source: Public Records
Mortgage History
| Date | Status | Borrower | Loan Amount |
|---|---|---|---|
| Open | Abbott Matthew | $362,700 | |
| Previous Owner | Cagle Steven T | $147,250 |
Source: Public Records
Tax History Compared to Growth
Tax History
| Year | Tax Paid | Tax Assessment Tax Assessment Total Assessment is a certain percentage of the fair market value that is determined by local assessors to be the total taxable value of land and additions on the property. | Land | Improvement |
|---|---|---|---|---|
| 2025 | $5,389 | $467,710 | $186,851 | $280,859 |
| 2024 | $5,389 | $458,540 | $183,188 | $275,352 |
| 2023 | $5,389 | $449,550 | $179,597 | $269,953 |
| 2022 | $4,976 | $440,736 | $176,076 | $264,660 |
| 2021 | $4,876 | $432,095 | $172,624 | $259,471 |
| 2020 | $4,936 | $427,665 | $170,854 | $256,811 |
| 2019 | $4,891 | $419,280 | $167,504 | $251,776 |
| 2018 | $4,862 | $411,060 | $164,220 | $246,840 |
| 2017 | $4,774 | $403,000 | $161,000 | $242,000 |
| 2016 | $2,603 | $220,233 | $85,250 | $134,983 |
| 2015 | $2,524 | $216,926 | $83,970 | $132,956 |
| 2014 | $2,432 | $212,678 | $82,326 | $130,352 |
Source: Public Records
Map
Nearby Homes
- 311 Algiers Ct
- 5015 Charmian Dr
- 537 Emerald Park Ct
- 305 Simone Place N
- 61 Coronado Cir
- 66 Coronado Cir
- 164 Brookview Ct
- 103 Glenoak Ct
- 5020 Roma St
- 71 Oakcreek Ct
- 29 Coronado Cir
- 5086 Charmian Dr
- 52 Oakstone Ct Unit 52
- 5209 San Luis Ave
- 48 Shadyleaf Ct
- 31 Springhill Ct
- 28 Springhill Ct
- 206 Indian Creek Dr
- 4705 Culebra Way
- 16 Redwood Ct Unit 55
- 421 Saint Mary Place
- 413 Saint Mary Place
- 425 Saint Mary Place
- 432 Tanglewood Ct
- 436 Tanglewood Ct
- 409 Saint Mary Place
- 428 Tanglewood Ct
- 440 Tanglewood Ct
- 429 Saint Mary Place
- 424 Tanglewood Ct
- 405 Saint Mary Place
- 418 Saint Mary Place
- 444 Tanglewood Ct
- 412 Saint Mary Place
- 422 Saint Mary Place
- 401 Saint Mary Place
- 400 Saint Mary Place
- 433 Saint Mary Place
- 426 Saint Mary Place
- 448 Tanglewood Ct