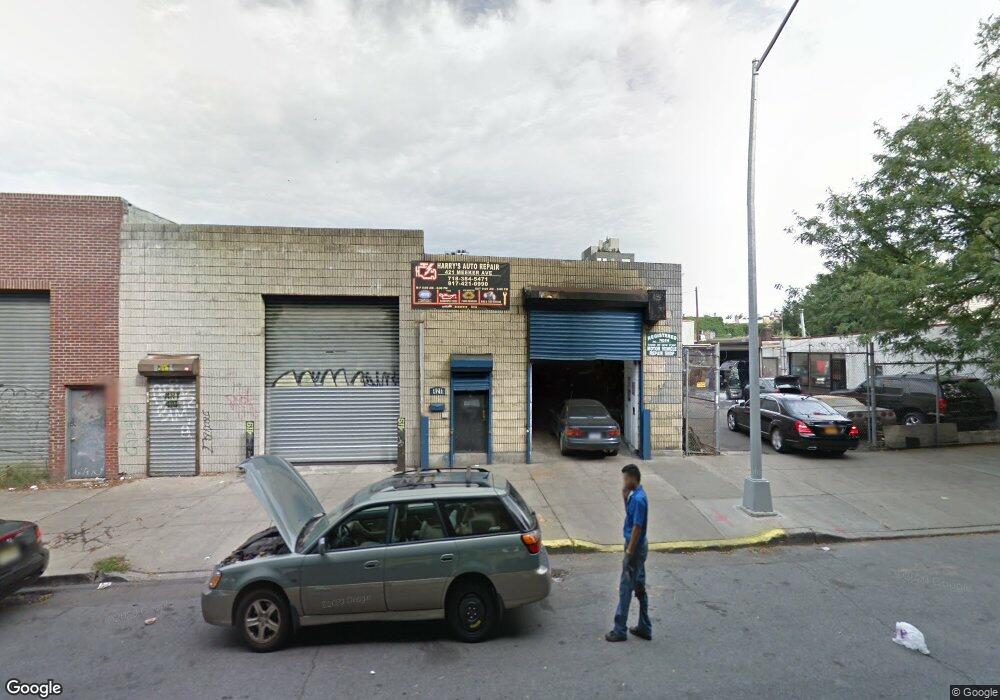
419-425 Meeker Ave Brooklyn, NY 11222
Greenpoint NeighborhoodEstimated Value: $2,986,427
--
Bed
--
Bath
3,870
Sq Ft
$772/Sq Ft
Est. Value
About This Home
This home is located at 419-425 Meeker Ave, Brooklyn, NY 11222 and is currently estimated at $2,986,427, approximately $771 per square foot. 419-425 Meeker Ave is a home located in Kings County with nearby schools including P.S. 34 Oliver H Perry, Success Academy Charter School-NYC 9, and Academy of the City Charter School.
Ownership History
Date
Name
Owned For
Owner Type
Purchase Details
Closed on
Dec 23, 2021
Sold by
Gitmour Llc
Bought by
Friedman Morris
Current Estimated Value
Purchase Details
Closed on
Jan 10, 2012
Sold by
Gitmor Trust
Bought by
Friedman Morris and Rubin Abraham
Purchase Details
Closed on
May 20, 2009
Sold by
Meeker Rf Llc
Bought by
Gitmor Llc
Purchase Details
Closed on
Feb 17, 2005
Sold by
Scanlon and Stacey
Bought by
Meeker Rf Llc
Purchase Details
Closed on
Sep 24, 1996
Sold by
Goldstein Jonathan
Bought by
Scanlon Stacey
Home Financials for this Owner
Home Financials are based on the most recent Mortgage that was taken out on this home.
Original Mortgage
$80,000
Interest Rate
10%
Mortgage Type
Seller Take Back
Purchase Details
Closed on
May 26, 1992
Sold by
Brenner George D and The Harry Goldstein Intervivos
Bought by
Goldstein Jonathan
Create a Home Valuation Report for This Property
The Home Valuation Report is an in-depth analysis detailing your home's value as well as a comparison with similar homes in the area
Home Values in the Area
Average Home Value in this Area
Purchase History
| Date | Buyer | Sale Price | Title Company |
|---|---|---|---|
| Friedman Morris | -- | -- | |
| Friedman Morris | -- | -- | |
| Friedman Morris | -- | -- | |
| Friedman Morris | -- | -- | |
| Gitmor Llc | -- | -- | |
| Gitmor Llc | -- | -- | |
| Meeker Rf Llc | $1,400,000 | -- | |
| Meeker Rf Llc | $1,400,000 | -- | |
| Scanlon Stacey | $100,000 | American Title Ins Co | |
| Scanlon Stacey | $100,000 | American Title Ins Co | |
| Goldstein Jonathan | -- | First American Title Ins Co | |
| Goldstein Jonathan | -- | First American Title Ins Co |
Source: Public Records
Mortgage History
| Date | Status | Borrower | Loan Amount |
|---|---|---|---|
| Previous Owner | Scanlon Stacey | $80,000 |
Source: Public Records
Tax History Compared to Growth
Tax History
| Year | Tax Paid | Tax Assessment Tax Assessment Total Assessment is a certain percentage of the fair market value that is determined by local assessors to be the total taxable value of land and additions on the property. | Land | Improvement |
|---|---|---|---|---|
| 2025 | $25,434 | $261,450 | $90,000 | $171,450 |
| 2024 | $25,434 | $264,150 | $90,000 | $174,150 |
| 2023 | $24,892 | $261,450 | $90,000 | $171,450 |
| 2022 | $24,092 | $238,950 | $90,000 | $148,950 |
| 2021 | $20,645 | $193,050 | $90,000 | $103,050 |
| 2020 | $11,646 | $232,650 | $90,000 | $142,650 |
| 2019 | $21,168 | $232,650 | $90,000 | $142,650 |
| 2018 | $19,143 | $212,400 | $90,000 | $122,400 |
| 2017 | $17,250 | $203,400 | $90,000 | $113,400 |
| 2016 | $15,189 | $181,800 | $90,000 | $91,800 |
| 2015 | $6,970 | $176,400 | $90,000 | $86,400 |
| 2014 | $6,970 | $136,350 | $90,000 | $46,350 |
Source: Public Records
Map
Nearby Homes
- 452 Graham Ave
- 390 Manhattan Ave Unit 4
- 390 Manhattan Ave Unit PH
- 390 Manhattan Ave Unit 2
- 390 Manhattan Ave Unit 3
- 390 Manhattan Ave Unit Residence 5
- 28 Herbert St Unit 5BB
- 28 Herbert St Unit PHA
- 28 Herbert St Unit 4B
- 28 Herbert St Unit 4C
- 28 Herbert St Unit 5A
- 28 Herbert St Unit 3A
- 28 Herbert St Unit 3B
- 28 Herbert St Unit 4AA
- 28 Herbert St Unit 5CC
- 185 Withers St Unit 3
- 382 Manhattan Ave
- 152 Withers St Unit 2B
- 447 Humboldt St
- 192 Withers St
- 417 Meeker Ave
- 433 Meeker Ave
- 433 Meeker Ave Unit 1
- 411 Meeker Ave Unit 3C
- 411 Meeker Ave Unit 4C
- 411 Meeker Ave Unit 4D
- 411 Meeker Ave Unit 3D
- 411 Meeker Ave Unit 5B
- 411 Meeker Ave Unit 3A
- 411 Meeker Ave Unit 5D
- 434 Manhattan Ave
- 435 Meeker Ave
- 130-132 Bayard St
- 134 Bayard St
- 136 Bayard St
- 441 Meeker Ave
- 138 Bayard St
- 140 Bayard St
- 419 Manhattan Ave
- 445 Meeker Ave