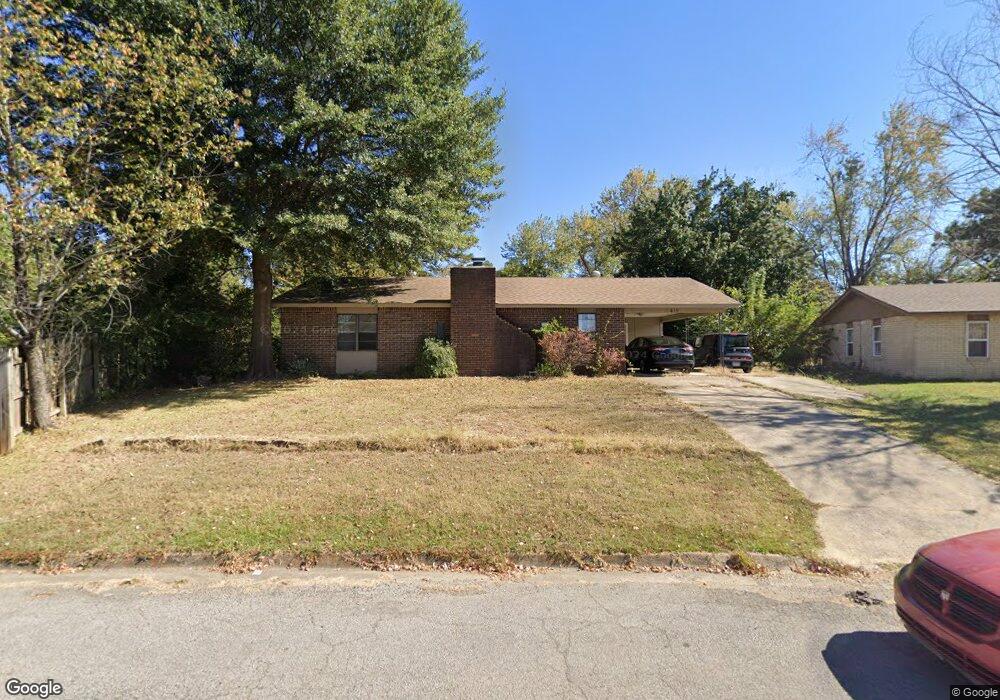
419 S 42nd St van Buren, AR 72956
Estimated Value: $121,000 - $135,742
--
Bed
2
Baths
1,178
Sq Ft
$108/Sq Ft
Est. Value
About This Home
This home is located at 419 S 42nd St, van Buren, AR 72956 and is currently estimated at $127,186, approximately $107 per square foot. 419 S 42nd St is a home located in Crawford County with nearby schools including James R. Tate Elementary School, Butterfield Trail Middle School, and Van Buren High School.
Ownership History
Date
Name
Owned For
Owner Type
Purchase Details
Closed on
Apr 11, 2016
Sold by
Secrctary Of Housing And Urban Developme
Bought by
Bagby Philip A
Current Estimated Value
Purchase Details
Closed on
Nov 18, 2015
Sold by
Jpmorgan Chase Bank Na
Bought by
The Secretary Of Hud
Purchase Details
Closed on
Sep 16, 2009
Sold by
Titsworth H Eugene and Colleen Titsworth G
Bought by
Hernandez Vilma M
Home Financials for this Owner
Home Financials are based on the most recent Mortgage that was taken out on this home.
Original Mortgage
$76,414
Interest Rate
5.2%
Mortgage Type
FHA
Purchase Details
Closed on
Jan 31, 2001
Bought by
Centex-Titsworth
Purchase Details
Closed on
Jan 12, 2001
Bought by
Johnson-Centex
Purchase Details
Closed on
Oct 1, 1993
Bought by
Foster-Johnson
Create a Home Valuation Report for This Property
The Home Valuation Report is an in-depth analysis detailing your home's value as well as a comparison with similar homes in the area
Home Values in the Area
Average Home Value in this Area
Purchase History
| Date | Buyer | Sale Price | Title Company |
|---|---|---|---|
| Bagby Philip A | $41,626 | Waco Title Company | |
| The Secretary Of Hud | -- | None Available | |
| Hernandez Vilma M | $80,000 | -- | |
| Centex-Titsworth | $32,000 | -- | |
| Johnson-Centex | -- | -- | |
| Foster-Johnson | -- | -- |
Source: Public Records
Mortgage History
| Date | Status | Borrower | Loan Amount |
|---|---|---|---|
| Previous Owner | Hernandez Vilma M | $76,414 |
Source: Public Records
Tax History Compared to Growth
Tax History
| Year | Tax Paid | Tax Assessment Tax Assessment Total Assessment is a certain percentage of the fair market value that is determined by local assessors to be the total taxable value of land and additions on the property. | Land | Improvement |
|---|---|---|---|---|
| 2025 | $918 | $19,000 | $3,300 | $15,700 |
| 2024 | $847 | $19,000 | $3,300 | $15,700 |
| 2023 | $776 | $19,000 | $3,300 | $15,700 |
| 2022 | $706 | $13,600 | $2,200 | $11,400 |
| 2021 | $706 | $13,600 | $2,200 | $11,400 |
| 2020 | $706 | $13,600 | $2,200 | $11,400 |
| 2019 | $706 | $13,600 | $2,200 | $11,400 |
| 2018 | $706 | $13,600 | $2,200 | $11,400 |
| 2017 | $748 | $14,410 | $2,200 | $12,210 |
| 2016 | $748 | $14,410 | $2,200 | $12,210 |
| 2015 | $355 | $14,410 | $2,200 | $12,210 |
| 2014 | $355 | $14,410 | $2,200 | $12,210 |
Source: Public Records
Map
Nearby Homes