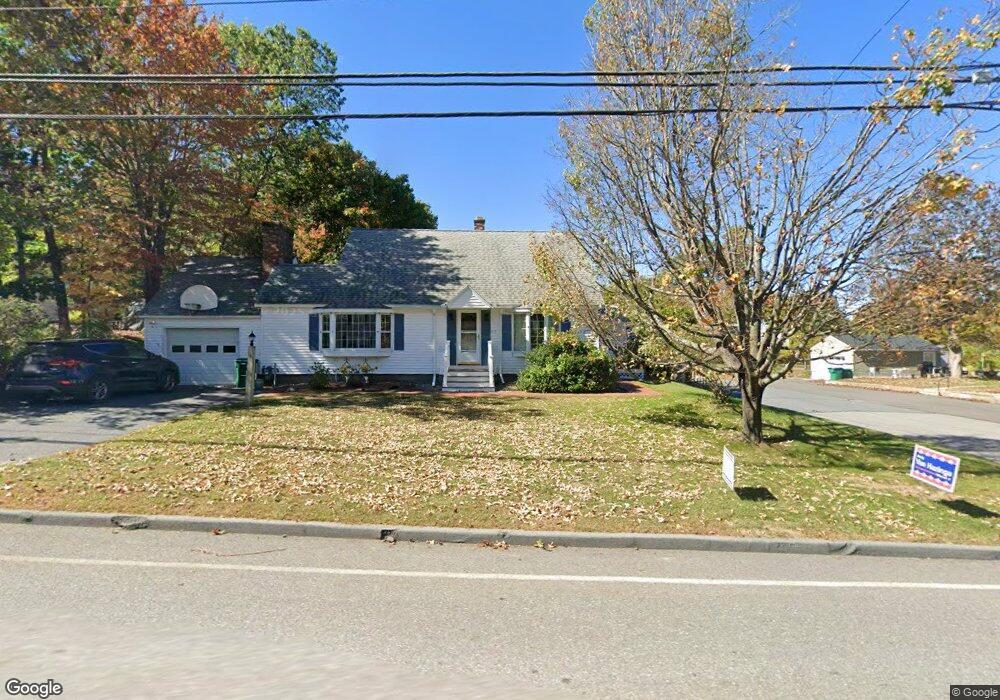
419 Shea St Fitchburg, MA 01420
Estimated Value: $437,000 - $497,000
3
Beds
3
Baths
1,662
Sq Ft
$278/Sq Ft
Est. Value
About This Home
This home is located at 419 Shea St, Fitchburg, MA 01420 and is currently estimated at $462,627, approximately $278 per square foot. 419 Shea St is a home located in Worcester County with nearby schools including Reingold Elementary School, South Street Elementary School, and Crocker Elementary School.
Ownership History
Date
Name
Owned For
Owner Type
Purchase Details
Closed on
Jan 27, 2016
Sold by
Pawlak Donna and Pawlak Michael J
Bought by
Raimon Laurice K and Keating Christpher C
Current Estimated Value
Home Financials for this Owner
Home Financials are based on the most recent Mortgage that was taken out on this home.
Original Mortgage
$149,800
Outstanding Balance
$119,495
Interest Rate
3.97%
Mortgage Type
New Conventional
Estimated Equity
$343,132
Purchase Details
Closed on
Oct 2, 2013
Sold by
Pawlak Samuel
Bought by
Pawlak Michael J and Cassiday Kelly
Purchase Details
Closed on
Jul 28, 1993
Sold by
Isabelle David R and Isabelle Gale Ann
Bought by
Pawlak Samuel and Pawlak Joanlee
Create a Home Valuation Report for This Property
The Home Valuation Report is an in-depth analysis detailing your home's value as well as a comparison with similar homes in the area
Home Values in the Area
Average Home Value in this Area
Purchase History
| Date | Buyer | Sale Price | Title Company |
|---|---|---|---|
| Raimon Laurice K | $214,000 | -- | |
| Pawlak Michael J | -- | -- | |
| Pawlak Samuel | $123,000 | -- |
Source: Public Records
Mortgage History
| Date | Status | Borrower | Loan Amount |
|---|---|---|---|
| Open | Raimon Laurice K | $149,800 | |
| Previous Owner | Pawlak Michael J | $10,000 | |
| Previous Owner | Pawlak Samuel | $113,222 | |
| Previous Owner | Pawlak Samuel | $103,000 |
Source: Public Records
Tax History Compared to Growth
Tax History
| Year | Tax Paid | Tax Assessment Tax Assessment Total Assessment is a certain percentage of the fair market value that is determined by local assessors to be the total taxable value of land and additions on the property. | Land | Improvement |
|---|---|---|---|---|
| 2025 | $52 | $382,400 | $114,600 | $267,800 |
| 2024 | $5,027 | $339,400 | $82,100 | $257,300 |
| 2023 | $4,923 | $307,300 | $73,300 | $234,000 |
| 2022 | $5,065 | $287,600 | $72,000 | $215,600 |
| 2021 | $5,355 | $281,400 | $69,500 | $211,900 |
| 2020 | $5,304 | $269,100 | $68,200 | $200,900 |
| 2019 | $4,754 | $232,000 | $69,500 | $162,500 |
| 2018 | $4,542 | $216,200 | $64,400 | $151,800 |
| 2017 | $4,418 | $205,600 | $63,200 | $142,400 |
| 2016 | $4,206 | $198,100 | $58,100 | $140,000 |
| 2015 | $4,033 | $195,000 | $55,600 | $139,400 |
| 2014 | $3,805 | $191,900 | $55,600 | $136,300 |
Source: Public Records
Map
Nearby Homes
- 36 Miles St
- 44 Bel Air Dr
- 41 Lee Ave
- 162 Delisle St
- 429 Oak Hill Rd
- 35 Bernadette St
- 53 Alice Ave
- 71 Belgian Way
- 166 Caspian Way
- 48 Belgian Way
- 0 Franklin Rd-Lots1-7 Unit 72947330
- 36 England Ave
- 521 Rollstone Rd
- 83 Eleanor St
- 48 Silver St
- 16 Caspian Way
- 34 Oak Leaf Rd
- 7 Green Briar Rd Unit 7
- 271 Beech St
- 108-R Pratt St