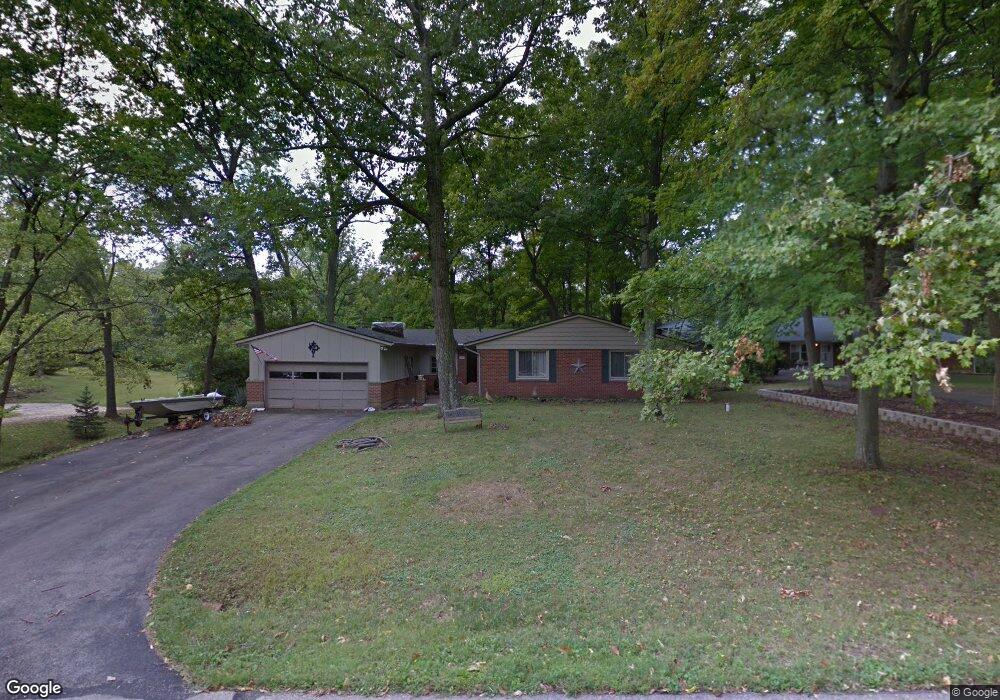
4191 Sunbeam Ave Beavercreek, OH 45440
Estimated Value: $335,000 - $377,000
3
Beds
2
Baths
2,049
Sq Ft
$173/Sq Ft
Est. Value
About This Home
This home is located at 4191 Sunbeam Ave, Beavercreek, OH 45440 and is currently estimated at $354,450, approximately $172 per square foot. 4191 Sunbeam Ave is a home located in Greene County with nearby schools including Fairbrook Elementary School, Herman K Ankeney Middle School, and Beavercreek High School.
Ownership History
Date
Name
Owned For
Owner Type
Purchase Details
Closed on
Oct 15, 2021
Sold by
Edmondson Tyler S and Edmondson Bethany C
Bought by
Rife William R
Current Estimated Value
Purchase Details
Closed on
Apr 15, 2019
Sold by
Leopard Investments Llc
Bought by
Edmondson Tyler S and Edmondson Bethany C
Home Financials for this Owner
Home Financials are based on the most recent Mortgage that was taken out on this home.
Original Mortgage
$181,800
Interest Rate
4.3%
Mortgage Type
New Conventional
Purchase Details
Closed on
Mar 6, 2018
Bought by
Leopard Investments Llc
Home Financials for this Owner
Home Financials are based on the most recent Mortgage that was taken out on this home.
Interest Rate
4.43%
Purchase Details
Closed on
Jan 21, 2011
Sold by
Ryan Robert Eugene and Ryan Florence R
Bought by
Ryan Robert E and Robert E Ryan Living Trust
Create a Home Valuation Report for This Property
The Home Valuation Report is an in-depth analysis detailing your home's value as well as a comparison with similar homes in the area
Home Values in the Area
Average Home Value in this Area
Purchase History
| Date | Buyer | Sale Price | Title Company |
|---|---|---|---|
| Rife William R | $280,000 | None Available | |
| Edmondson Tyler S | $205,000 | None Available | |
| Leopard Investments Llc | $120,000 | -- | |
| Ryan Robert E | -- | Attorney |
Source: Public Records
Mortgage History
| Date | Status | Borrower | Loan Amount |
|---|---|---|---|
| Previous Owner | Edmondson Tyler S | $181,800 | |
| Previous Owner | Leopard Investments Llc | -- |
Source: Public Records
Tax History Compared to Growth
Tax History
| Year | Tax Paid | Tax Assessment Tax Assessment Total Assessment is a certain percentage of the fair market value that is determined by local assessors to be the total taxable value of land and additions on the property. | Land | Improvement |
|---|---|---|---|---|
| 2024 | $5,759 | $98,010 | $16,440 | $81,570 |
| 2023 | $5,759 | $98,010 | $16,440 | $81,570 |
| 2022 | $5,340 | $72,200 | $12,640 | $59,560 |
| 2021 | $4,650 | $62,880 | $12,640 | $50,240 |
| 2020 | $4,685 | $62,880 | $12,640 | $50,240 |
| 2019 | $4,683 | $57,380 | $11,840 | $45,540 |
| 2018 | $3,432 | $57,380 | $11,840 | $45,540 |
| 2017 | $3,031 | $57,380 | $11,840 | $45,540 |
| 2016 | $3,032 | $50,360 | $11,840 | $38,520 |
| 2015 | $3,014 | $50,360 | $11,840 | $38,520 |
| 2014 | $2,969 | $50,360 | $11,840 | $38,520 |
Source: Public Records
Map
Nearby Homes
- 4212 Seema Dr
- 419 Carleton Dr
- 4049 Pepperwell Cir
- 3878 Pepperwell Cir
- 3899 Pepperwell Cir
- 470 Cloverhill Ct
- 4489 Bucksport Ct
- 4493 Bucksport Ct
- 4227 Wagner Rd
- 281 Locust Ct
- 2841 Corlington Dr
- 3170 E Stroop Rd
- 3170 E Stroop Rd Unit 307
- 892 Little Sugar Creek Rd
- 2816 Corlington Dr
- 3908 Barrymore Ln
- 3033 Glenmere Ct
- 3073 Santa Rosa Dr
- 3117 Swigert Rd
- 3978 Indian Ripple Rd
- 4201 Sunbeam Ave
- 4181 Sunbeam Ave
- 4211 Sunbeam Ave
- 450 Tanglewood Dr
- 4171 Sunbeam Ave
- 4182 Sunbeam Ave
- 4221 Sunbeam Ave
- 445 Tanglewood Dr
- 4172 Sunbeam Ave
- 440 Tanglewood Dr
- 510 Silvercrest Terrace
- 425 Tanglewood Dr
- 4156 Sunbeam Ave
- 430 Tanglewood Dr
- 4151 Sunbeam Ave
- 4232 Sunbeam Ave
- 433 Silvercrest Terrace
- 4241 Sunbeam Ave
- 420 Tanglewood Dr
- 425 Silvercrest Terrace