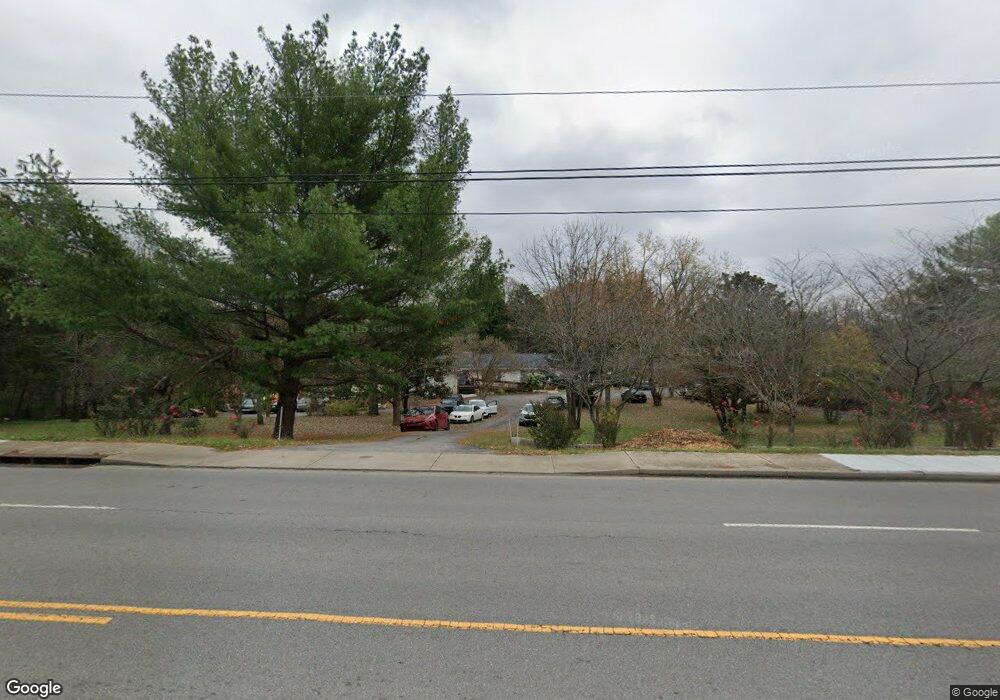
4197 Andrew Jackson Pkwy Hermitage, TN 37076
Hermitage NeighborhoodEstimated Value: $603,000 - $1,121,000
4
Beds
6
Baths
5,629
Sq Ft
$163/Sq Ft
Est. Value
About This Home
This home is located at 4197 Andrew Jackson Pkwy, Hermitage, TN 37076 and is currently estimated at $914,895, approximately $162 per square foot. 4197 Andrew Jackson Pkwy is a home located in Davidson County with nearby schools including Tulip Grove Elementary School, DuPont Tyler Middle School, and McGavock High School.
Ownership History
Date
Name
Owned For
Owner Type
Purchase Details
Closed on
May 23, 2017
Sold by
Vangs John J
Bought by
Perry Kimie
Current Estimated Value
Purchase Details
Closed on
Aug 18, 2010
Sold by
Bown Susan L
Bought by
Vanags John J
Purchase Details
Closed on
Oct 1, 2008
Sold by
Vanags John J
Bought by
Vanags John J and Bown Susan L
Purchase Details
Closed on
Aug 12, 2005
Sold by
Vanags John J and Vanags Judy
Bought by
Vanags John J
Purchase Details
Closed on
Jan 11, 2005
Sold by
Baker James H and Baker Jean M
Bought by
Vanags John J and Bown Susan
Home Financials for this Owner
Home Financials are based on the most recent Mortgage that was taken out on this home.
Original Mortgage
$282,000
Interest Rate
6.95%
Purchase Details
Closed on
Jan 20, 1999
Sold by
Baker James H and Baker Jean M
Bought by
Baker James H and Baker Jean M
Create a Home Valuation Report for This Property
The Home Valuation Report is an in-depth analysis detailing your home's value as well as a comparison with similar homes in the area
Home Values in the Area
Average Home Value in this Area
Purchase History
| Date | Buyer | Sale Price | Title Company |
|---|---|---|---|
| Perry Kimie | -- | None Available | |
| Vanags John J | -- | None Available | |
| Vanags John J | -- | Cumberland Title | |
| Vanags John J | -- | -- | |
| Vanags John J | $282,000 | Realty Title & Escrow | |
| Baker James H | -- | -- |
Source: Public Records
Mortgage History
| Date | Status | Borrower | Loan Amount |
|---|---|---|---|
| Previous Owner | Vanags John J | $282,000 |
Source: Public Records
Tax History Compared to Growth
Tax History
| Year | Tax Paid | Tax Assessment Tax Assessment Total Assessment is a certain percentage of the fair market value that is determined by local assessors to be the total taxable value of land and additions on the property. | Land | Improvement |
|---|---|---|---|---|
| 2024 | $4,615 | $157,950 | $40,950 | $117,000 |
| 2023 | $4,615 | $157,950 | $40,950 | $117,000 |
| 2022 | $4,615 | $157,950 | $40,950 | $117,000 |
| 2021 | $4,664 | $157,950 | $40,950 | $117,000 |
| 2020 | $4,846 | $127,925 | $22,675 | $105,250 |
| 2019 | $3,524 | $127,925 | $22,675 | $105,250 |
| 2018 | $3,524 | $127,925 | $22,675 | $105,250 |
| 2017 | $0 | $132,433 | $30,838 | $101,595 |
| 2016 | $5,162 | $131,543 | $20,808 | $110,735 |
| 2015 | $5,162 | $131,543 | $20,808 | $110,735 |
| 2014 | $5,162 | $131,543 | $20,808 | $110,735 |
Source: Public Records
Map
Nearby Homes
- 1601 Pakenhams Retreat
- 1440 Stoner Ridge
- 1029 Rachels Square Dr
- 4302B Baton Rouge Dr
- 204 Stoners Glen Ct
- 207 Stoners Glen Ct
- 806 Bradley Place
- 660 Mercer Dr
- 4347 Baton Rouge Dr
- 709 Saddle Trail Ct
- 4451 Chandler Rd
- 8207 Luree Ln
- 8310 Luree Ln
- 633 Netherlands Dr
- 4309 Oakcrest Ln
- 8309 Luree Ln
- 8307 Luree Ln
- 916 Cointreau Dr
- 4389 Baton Rouge Dr
- 413 Hunters Path Ct
- 4191 Andrew Jackson Pkwy
- 1525 Stoner Valley
- 1617 Pakenhams Retreat
- 1521 Stoner Valley
- 1613 Pakenhams Retreat
- 1617 Pakenhams Retreat
- 1520 Stoner Valley
- 1240 Andrew Donelson Dr
- 1616 Pakenhams Retreat
- 4181 Andrew Jackson Pkwy
- 1609 Pakenhams Retreat
- 1513 Stoner Valley
- 1516 Stoner Valley
- 1236 Andrew Donelson Dr
- 1612 Pakenhams Retreat
- 505 Tyler Dr
- 1512 Stoner Valley
- 1265 Andrew Donelson Dr
- 1605 Pakenhams Retreat
- 1608 Pakenhams Retreat