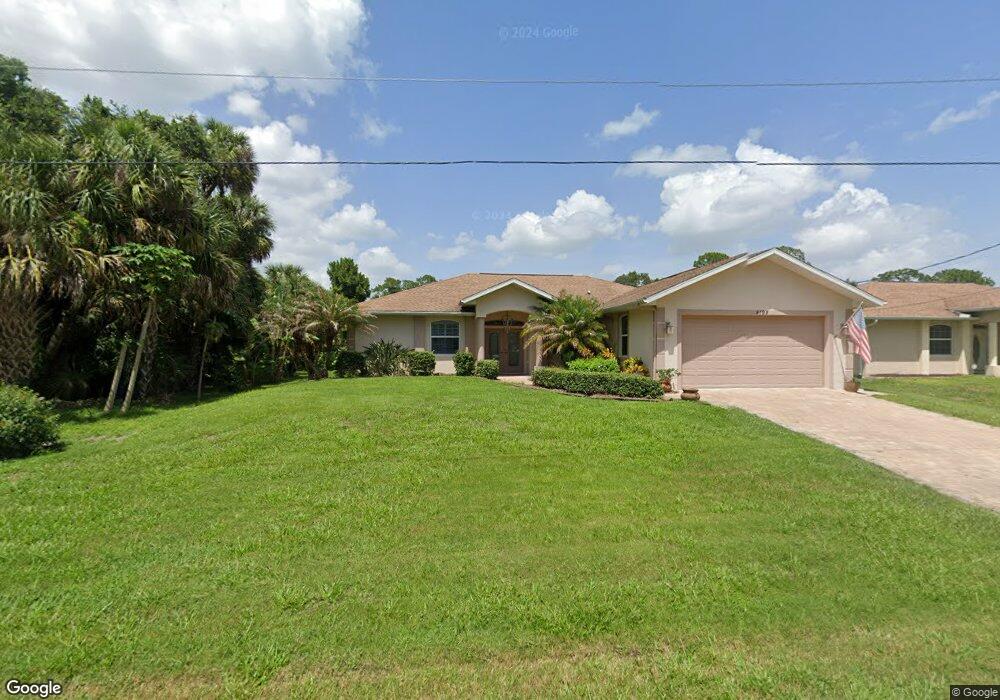
4198 Galvin Ln North Port, FL 34288
Estimated Value: $321,000 - $365,876
3
Beds
2
Baths
2,600
Sq Ft
$132/Sq Ft
Est. Value
About This Home
This home is located at 4198 Galvin Ln, North Port, FL 34288 and is currently estimated at $343,219, approximately $132 per square foot. 4198 Galvin Ln is a home located in Sarasota County with nearby schools including Atwater Elementary School, North Port High School, and Woodland Middle School.
Ownership History
Date
Name
Owned For
Owner Type
Purchase Details
Closed on
Jun 13, 2013
Sold by
Hoskinson Diane L and Hoskinson Rodney R
Bought by
Hoskinson Rodney R and Hoskinson Diane L
Current Estimated Value
Purchase Details
Closed on
Jun 4, 2010
Sold by
Baygulow Elena and Baygulow Serge
Bought by
Hoskinson Diane L and Hoskinson Rodney R
Purchase Details
Closed on
May 14, 2010
Sold by
Baygulov Viktor G
Bought by
Baygulova Olga
Purchase Details
Closed on
Sep 4, 2009
Sold by
Baygulow Serge
Bought by
Baygulow Elena
Purchase Details
Closed on
Feb 10, 2009
Sold by
National City Bank
Bought by
Baygulow Serge and Baygulow Elena
Purchase Details
Closed on
Jul 21, 2008
Sold by
Land Trust Service Corp
Bought by
National City Bank
Purchase Details
Closed on
Apr 21, 2006
Sold by
Gerber Dennis S
Bought by
Trust #11-A
Purchase Details
Closed on
Apr 11, 2005
Sold by
Angelica Land Lc
Bought by
Gerber Dennis S
Create a Home Valuation Report for This Property
The Home Valuation Report is an in-depth analysis detailing your home's value as well as a comparison with similar homes in the area
Home Values in the Area
Average Home Value in this Area
Purchase History
| Date | Buyer | Sale Price | Title Company |
|---|---|---|---|
| Hoskinson Rodney R | -- | Attorney | |
| Hoskinson Diane L | $135,000 | Shoreland Title Inc | |
| Baygulova Olga | -- | None Available | |
| Baygulow Elena | -- | None Available | |
| Baygulow Serge | $53,000 | Attorney | |
| National City Bank | -- | Attorney | |
| Trust #11-A | -- | None Available | |
| Gerber Dennis S | $33,000 | Florida Paradise Title Llc |
Source: Public Records
Tax History Compared to Growth
Tax History
| Year | Tax Paid | Tax Assessment Tax Assessment Total Assessment is a certain percentage of the fair market value that is determined by local assessors to be the total taxable value of land and additions on the property. | Land | Improvement |
|---|---|---|---|---|
| 2024 | $1,744 | $127,562 | -- | -- |
| 2023 | $1,744 | $113,947 | $0 | $0 |
| 2022 | $1,855 | $120,528 | $0 | $0 |
| 2021 | $1,808 | $117,017 | $0 | $0 |
| 2020 | $1,868 | $115,401 | $0 | $0 |
| 2019 | $1,783 | $112,806 | $0 | $0 |
| 2018 | $1,729 | $110,703 | $0 | $0 |
| 2017 | $1,702 | $108,426 | $0 | $0 |
| 2016 | $1,688 | $166,900 | $3,700 | $163,200 |
| 2015 | $1,697 | $137,900 | $3,700 | $134,200 |
| 2014 | $1,658 | $103,075 | $0 | $0 |
Source: Public Records
Map
Nearby Homes
- 16 Basket St
- 4253 Golfair Ln
- 3617 Inverness St
- 0 Merriam Ln Unit MFRO6328911
- 4253 Killdeer Terrace
- 0 Bennington St Unit MFRC7500517
- 0 Bennington St Unit MFRC7510018
- 4343 Killdeer Terrace
- Lot 28 Wentworth St
- LOT #18 Wentworth St
- 4324 Knowles Ln
- 4120 Pasadena Ln
- 3320 S San Mateo Dr
- Lot 4 Bernhard Rd
- Lot 3 Bernhard Rd
- 4637 Corbett Ln
- 0 Hungary Rd Unit MFRTB8416453
- LOT 13 Baynes Rd
- 0 Baynes Rd Unit MFRC7511766
- 0 Baynes Rd Unit MFRC7511767