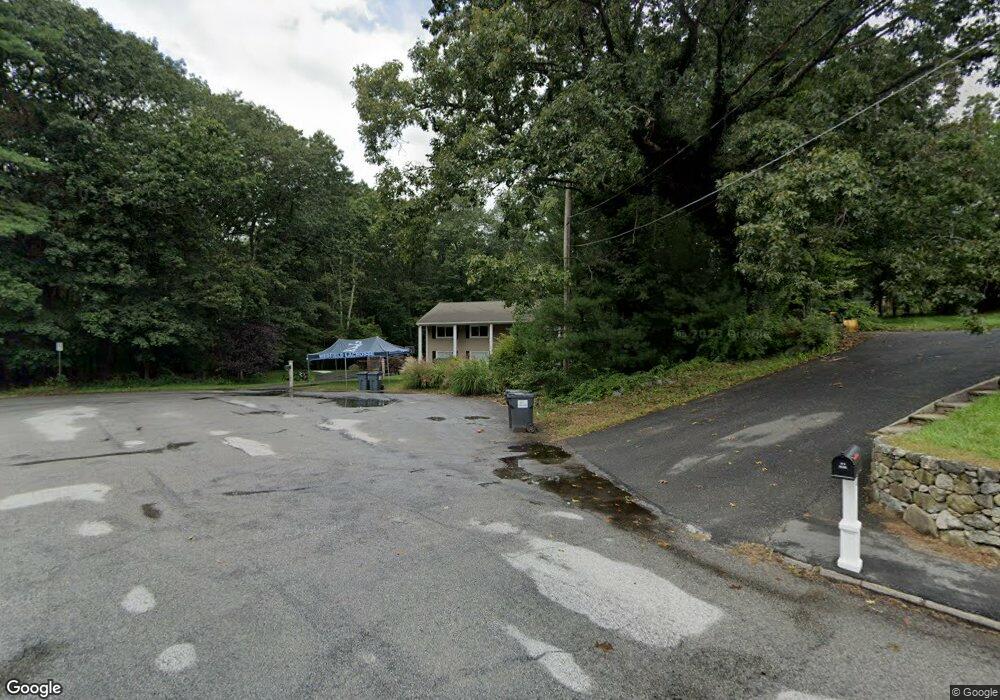
42 Hillcrest Rd Medfield, MA 02052
Estimated Value: $955,000 - $1,123,000
4
Beds
3
Baths
2,514
Sq Ft
$415/Sq Ft
Est. Value
About This Home
This home is located at 42 Hillcrest Rd, Medfield, MA 02052 and is currently estimated at $1,043,909, approximately $415 per square foot. 42 Hillcrest Rd is a home located in Norfolk County with nearby schools including Ralph Wheelock School, Memorial School, and Dale Street School.
Ownership History
Date
Name
Owned For
Owner Type
Purchase Details
Closed on
Oct 14, 2016
Sold by
Mcdonald Michael D
Bought by
Teachout Christopher J and Teachout Susanne D
Current Estimated Value
Home Financials for this Owner
Home Financials are based on the most recent Mortgage that was taken out on this home.
Original Mortgage
$508,000
Outstanding Balance
$398,928
Interest Rate
3%
Mortgage Type
New Conventional
Estimated Equity
$644,981
Purchase Details
Closed on
Aug 14, 2013
Sold by
Mcdonald Michael D and Mcdonald Kristen
Bought by
Mcdonald Michael D
Home Financials for this Owner
Home Financials are based on the most recent Mortgage that was taken out on this home.
Original Mortgage
$310,000
Interest Rate
4.31%
Mortgage Type
New Conventional
Purchase Details
Closed on
Jul 5, 2001
Sold by
Sienkiewicz Paul H and Sienkiewicz Faye E
Bought by
Mcdonald Michael D and Mcdonald Kristen
Purchase Details
Closed on
Mar 15, 1995
Sold by
Mary E Fish Ft
Bought by
Highgate T
Purchase Details
Closed on
Jun 24, 1994
Sold by
Silberstein David S
Bought by
Sienkiewicz Paul M and Sienkiewicz Faye E
Purchase Details
Closed on
Nov 2, 1987
Sold by
Codispoti J D
Bought by
Silberstein David S
Create a Home Valuation Report for This Property
The Home Valuation Report is an in-depth analysis detailing your home's value as well as a comparison with similar homes in the area
Home Values in the Area
Average Home Value in this Area
Purchase History
| Date | Buyer | Sale Price | Title Company |
|---|---|---|---|
| Teachout Christopher J | $635,000 | -- | |
| Mcdonald Michael D | -- | -- | |
| Mcdonald Michael D | $395,000 | -- | |
| Highgate T | $195,000 | -- | |
| Highgate T | $195,000 | -- | |
| Sienkiewicz Paul M | $269,900 | -- | |
| Sienkiewicz Paul M | $269,900 | -- | |
| Silberstein David S | $259,000 | -- |
Source: Public Records
Mortgage History
| Date | Status | Borrower | Loan Amount |
|---|---|---|---|
| Open | Teachout Christopher J | $508,000 | |
| Previous Owner | Silberstein David S | $310,000 |
Source: Public Records
Tax History Compared to Growth
Tax History
| Year | Tax Paid | Tax Assessment Tax Assessment Total Assessment is a certain percentage of the fair market value that is determined by local assessors to be the total taxable value of land and additions on the property. | Land | Improvement |
|---|---|---|---|---|
| 2025 | $11,335 | $821,400 | $470,900 | $350,500 |
| 2024 | $10,828 | $739,600 | $422,300 | $317,300 |
| 2023 | $10,682 | $692,300 | $404,700 | $287,600 |
| 2022 | $10,466 | $600,800 | $387,100 | $213,700 |
| 2021 | $10,198 | $574,200 | $383,600 | $190,600 |
| 2020 | $9,965 | $558,900 | $374,800 | $184,100 |
| 2019 | $9,644 | $539,700 | $364,200 | $175,500 |
| 2018 | $8,862 | $520,400 | $351,900 | $168,500 |
| 2017 | $8,656 | $512,500 | $348,400 | $164,100 |
| 2016 | $8,558 | $510,900 | $348,400 | $162,500 |
| 2015 | $7,863 | $490,200 | $338,500 | $151,700 |
| 2014 | $7,267 | $450,800 | $299,100 | $151,700 |
Source: Public Records
Map
Nearby Homes