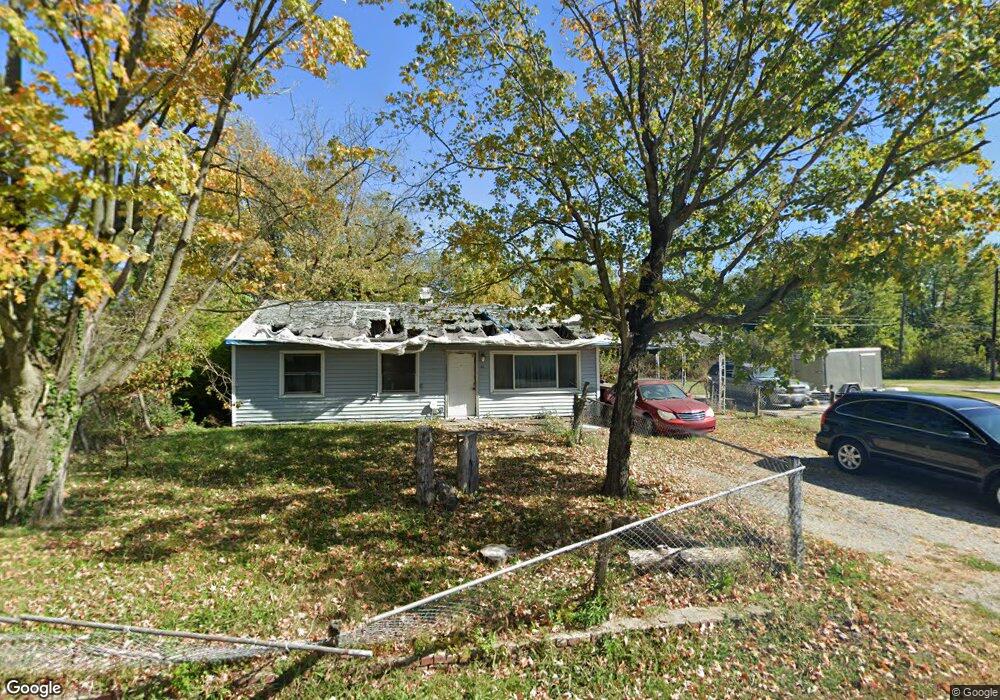
42 Lauralee Dr East Saint Louis, IL 62206
Estimated Value: $40,000 - $67,000
--
Bed
--
Bath
925
Sq Ft
$54/Sq Ft
Est. Value
About This Home
This home is located at 42 Lauralee Dr, East Saint Louis, IL 62206 and is currently estimated at $50,141, approximately $54 per square foot. 42 Lauralee Dr is a home located in St. Clair County.
Ownership History
Date
Name
Owned For
Owner Type
Purchase Details
Closed on
Mar 29, 2021
Sold by
Sta Clair County
Bought by
Conway Tremika
Current Estimated Value
Purchase Details
Closed on
Aug 18, 2020
Sold by
Lee Henley Bettie
Bought by
St Clair County and Rust No 07 08 0 101 007
Purchase Details
Closed on
Nov 14, 2013
Sold by
County Of Saint Clair
Bought by
Henley Bettie Lee and Watson Sarah
Purchase Details
Closed on
Jul 26, 2013
Sold by
Henley Bettie L and Watson Sarah
Bought by
County Of Saint Clair
Purchase Details
Closed on
Dec 27, 1999
Bought by
Henley Bettie Lee and Watson Sar
Create a Home Valuation Report for This Property
The Home Valuation Report is an in-depth analysis detailing your home's value as well as a comparison with similar homes in the area
Home Values in the Area
Average Home Value in this Area
Purchase History
| Date | Buyer | Sale Price | Title Company |
|---|---|---|---|
| Conway Tremika | -- | None Available | |
| St Clair County | -- | Attorney | |
| Henley Bettie Lee | -- | None Available | |
| County Of Saint Clair | -- | None Available | |
| Henley Bettie Lee | $10,000 | -- |
Source: Public Records
Tax History Compared to Growth
Tax History
| Year | Tax Paid | Tax Assessment Tax Assessment Total Assessment is a certain percentage of the fair market value that is determined by local assessors to be the total taxable value of land and additions on the property. | Land | Improvement |
|---|---|---|---|---|
| 2024 | $324 | $2,174 | $462 | $1,712 |
| 2023 | $291 | $1,965 | $418 | $1,547 |
| 2022 | $250 | $1,722 | $366 | $1,356 |
| 2021 | $0 | $102 | $51 | $51 |
| 2020 | $731 | $4,234 | $364 | $3,870 |
| 2019 | $731 | $4,234 | $364 | $3,870 |
| 2018 | $739 | $4,296 | $369 | $3,927 |
| 2017 | $789 | $4,192 | $360 | $3,832 |
| 2016 | $874 | $4,681 | $359 | $4,322 |
| 2014 | -- | $4,630 | $355 | $4,275 |
| 2013 | -- | $4,343 | $333 | $4,010 |
Source: Public Records
Map
Nearby Homes