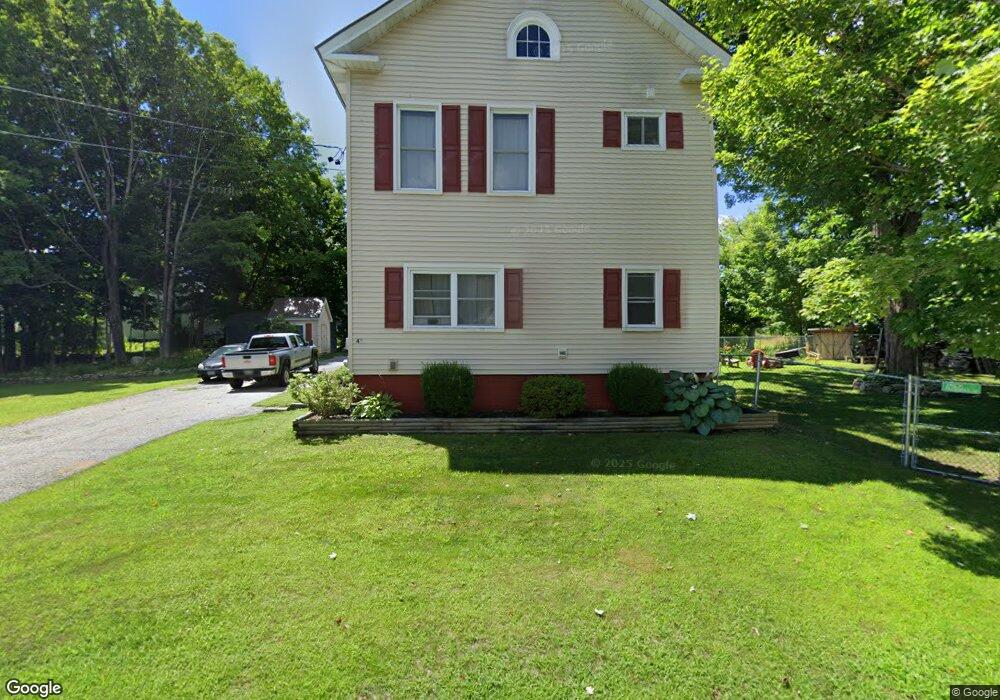
42 Oak St Mechanic Falls, ME 04256
Estimated Value: $305,000 - $372,000
4
Beds
2
Baths
2,166
Sq Ft
$154/Sq Ft
Est. Value
About This Home
This home is located at 42 Oak St, Mechanic Falls, ME 04256 and is currently estimated at $333,323, approximately $153 per square foot. 42 Oak St is a home located in Androscoggin County with nearby schools including Elm Street School - Mechanic Falls.
Ownership History
Date
Name
Owned For
Owner Type
Purchase Details
Closed on
Nov 28, 2018
Sold by
Hamlyn Michael R and Bodwell Debra N
Bought by
Morgan Karey A and Morgan Stanley W
Current Estimated Value
Home Financials for this Owner
Home Financials are based on the most recent Mortgage that was taken out on this home.
Original Mortgage
$145,299
Outstanding Balance
$128,012
Interest Rate
4.8%
Mortgage Type
FHA
Estimated Equity
$205,311
Purchase Details
Closed on
Mar 24, 2009
Sold by
Aames Home Loan
Bought by
Hamlyn Michael
Create a Home Valuation Report for This Property
The Home Valuation Report is an in-depth analysis detailing your home's value as well as a comparison with similar homes in the area
Home Values in the Area
Average Home Value in this Area
Purchase History
| Date | Buyer | Sale Price | Title Company |
|---|---|---|---|
| Morgan Karey A | -- | -- | |
| Hamlyn Michael | $27,500 | -- |
Source: Public Records
Mortgage History
| Date | Status | Borrower | Loan Amount |
|---|---|---|---|
| Open | Morgan Karey A | $145,299 |
Source: Public Records
Tax History Compared to Growth
Tax History
| Year | Tax Paid | Tax Assessment Tax Assessment Total Assessment is a certain percentage of the fair market value that is determined by local assessors to be the total taxable value of land and additions on the property. | Land | Improvement |
|---|---|---|---|---|
| 2024 | $3,369 | $218,768 | $44,435 | $174,333 |
| 2023 | $3,003 | $214,504 | $44,435 | $170,069 |
| 2022 | $2,841 | $127,676 | $21,669 | $106,007 |
| 2021 | $2,758 | $127,676 | $21,669 | $106,007 |
| 2020 | $2,739 | $127,676 | $21,669 | $106,007 |
| 2019 | $2,675 | $127,676 | $21,669 | $106,007 |
| 2018 | $2,783 | $127,676 | $21,669 | $106,007 |
| 2017 | $2,809 | $127,676 | $21,669 | $106,007 |
| 2016 | $2,722 | $127,676 | $21,669 | $106,007 |
| 2015 | $2,732 | $127,676 | $21,669 | $106,007 |
| 2014 | $2,707 | $127,676 | $21,669 | $106,007 |
Source: Public Records
Map
Nearby Homes