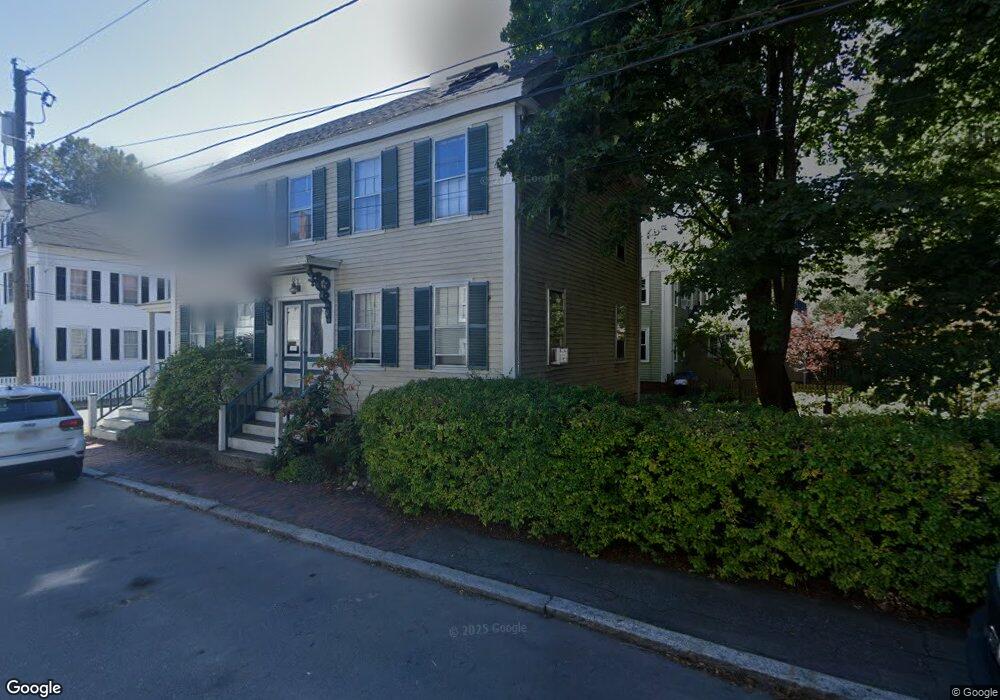
42 Prospect St Newburyport, MA 01950
Estimated Value: $962,000 - $1,400,000
4
Beds
3
Baths
2,671
Sq Ft
$426/Sq Ft
Est. Value
About This Home
This home is located at 42 Prospect St, Newburyport, MA 01950 and is currently estimated at $1,138,644, approximately $426 per square foot. 42 Prospect St is a home located in Essex County with nearby schools including Francis T. Bresnahan Elementary School, Edward G. Molin Elementary School, and Rupert A. Nock Middle School.
Ownership History
Date
Name
Owned For
Owner Type
Purchase Details
Closed on
Sep 20, 2024
Sold by
Klose Kathleen
Bought by
Finno Ft and Harris
Current Estimated Value
Purchase Details
Closed on
Mar 3, 2009
Sold by
Klose Kathleen
Bought by
Klose Kathleen
Home Financials for this Owner
Home Financials are based on the most recent Mortgage that was taken out on this home.
Original Mortgage
$348,750
Interest Rate
5%
Mortgage Type
Purchase Money Mortgage
Purchase Details
Closed on
Sep 22, 1988
Sold by
Walker Lillian
Bought by
Harris Jay
Create a Home Valuation Report for This Property
The Home Valuation Report is an in-depth analysis detailing your home's value as well as a comparison with similar homes in the area
Home Values in the Area
Average Home Value in this Area
Purchase History
| Date | Buyer | Sale Price | Title Company |
|---|---|---|---|
| Finno Ft | -- | None Available | |
| Finno Ft | -- | None Available | |
| Klose Kathleen | -- | -- | |
| Klose Kathleen | -- | -- | |
| Harris Jay | $176,800 | -- |
Source: Public Records
Mortgage History
| Date | Status | Borrower | Loan Amount |
|---|---|---|---|
| Previous Owner | Harris Jay | $348,750 | |
| Previous Owner | Harris Jay | $65,000 |
Source: Public Records
Tax History Compared to Growth
Tax History
| Year | Tax Paid | Tax Assessment Tax Assessment Total Assessment is a certain percentage of the fair market value that is determined by local assessors to be the total taxable value of land and additions on the property. | Land | Improvement |
|---|---|---|---|---|
| 2025 | $8,224 | $858,500 | $420,900 | $437,600 |
| 2024 | $7,907 | $793,100 | $382,600 | $410,500 |
| 2023 | $7,610 | $708,600 | $332,700 | $375,900 |
| 2022 | $7,513 | $625,600 | $277,200 | $348,400 |
| 2021 | $7,209 | $570,300 | $252,000 | $318,300 |
| 2020 | $7,067 | $550,400 | $252,000 | $298,400 |
| 2019 | $6,548 | $500,600 | $252,000 | $248,600 |
| 2018 | $6,427 | $484,700 | $240,000 | $244,700 |
| 2017 | $5,910 | $439,400 | $228,600 | $210,800 |
| 2016 | $5,585 | $417,100 | $208,300 | $208,800 |
| 2015 | $5,245 | $393,200 | $208,300 | $184,900 |
Source: Public Records
Map
Nearby Homes
- 11 Orange St Unit 2
- 105 State St Unit 301
- 105 State St Unit 101
- 105 State St Unit 201
- 95 High St Unit 4
- 95 High St Unit 1
- 42 Federal St Unit B
- 58 Lime St Unit 5
- 11 Charter St
- 57 Lime St Unit 1
- 113 Prospect St Unit B
- 10 10th St
- 30-32 Water St Unit 4
- 1 Hill St
- 1 Hill St Unit 1
- 2 Court St Unit 4
- 164 Water St Unit A
- 166 Water St Unit B
- 58 Merrimac St Unit 2-5
- 17 Madison St
- 38 Prospect St
- 45 Prospect St
- 43 Prospect St
- 14 Tremont St
- 6 Tremont St
- 6 Tremont St Unit 1
- 8 Tremont St
- 44 Prospect St
- 47 Prospect St
- 47 Prospect St Unit 1
- 34 Prospect St Unit 36
- 34-36 Prospect St Unit 2
- 34-36 Prospect St Unit 1
- 4 Tremont St
- 10 Tremont St
- 49 Prospect St
- 49 Prospect St Unit 1
- 41 Prospect St
- 12 Tremont St
- 12 Tremont St Unit E