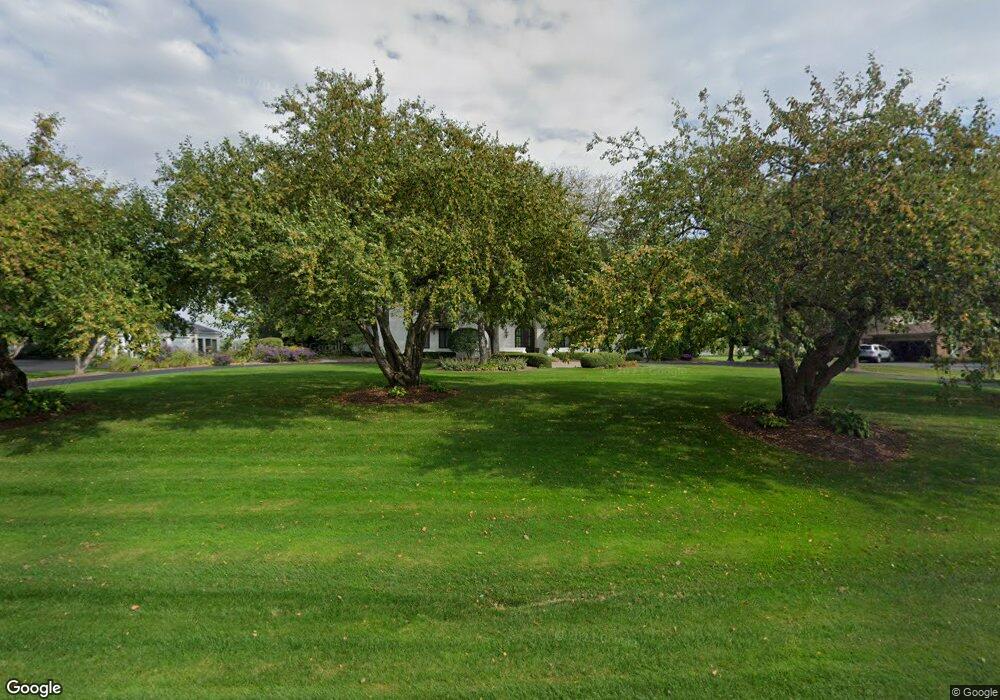
42 Watergate Dr South Barrington, IL 60010
Estimated Value: $1,187,988 - $1,644,000
6
Beds
5
Baths
5,566
Sq Ft
$248/Sq Ft
Est. Value
About This Home
This home is located at 42 Watergate Dr, South Barrington, IL 60010 and is currently estimated at $1,378,247, approximately $247 per square foot. 42 Watergate Dr is a home located in Cook County with nearby schools including Barbara B. Rose Elementary School, Barrington Middle School Station Campus, and Barrington High School.
Ownership History
Date
Name
Owned For
Owner Type
Purchase Details
Closed on
Oct 18, 2017
Sold by
Higgins Kent R and Higgins Lori A
Bought by
Higgins Lori A and The Lori A Higgins Trust
Current Estimated Value
Home Financials for this Owner
Home Financials are based on the most recent Mortgage that was taken out on this home.
Original Mortgage
$825,000
Outstanding Balance
$683,109
Interest Rate
3.5%
Mortgage Type
Adjustable Rate Mortgage/ARM
Estimated Equity
$695,138
Purchase Details
Closed on
Jul 31, 2014
Sold by
Decker William E and Decker Judith A
Bought by
William E Decker Trust
Purchase Details
Closed on
May 14, 1998
Sold by
Ceas William G and Ceas Joan T
Bought by
Decker William E and Decker Judith A
Create a Home Valuation Report for This Property
The Home Valuation Report is an in-depth analysis detailing your home's value as well as a comparison with similar homes in the area
Home Values in the Area
Average Home Value in this Area
Purchase History
| Date | Buyer | Sale Price | Title Company |
|---|---|---|---|
| Higgins Lori A | -- | None Available | |
| Higgins Kent R | $1,100,000 | Chicago Title | |
| William E Decker Trust | -- | None Available | |
| Decker William E | $690,000 | Professional National Title |
Source: Public Records
Mortgage History
| Date | Status | Borrower | Loan Amount |
|---|---|---|---|
| Open | Higgins Kent R | $825,000 |
Source: Public Records
Tax History Compared to Growth
Tax History
| Year | Tax Paid | Tax Assessment Tax Assessment Total Assessment is a certain percentage of the fair market value that is determined by local assessors to be the total taxable value of land and additions on the property. | Land | Improvement |
|---|---|---|---|---|
| 2024 | $16,133 | $71,362 | $15,591 | $55,771 |
| 2023 | $20,118 | $77,151 | $15,591 | $61,560 |
| 2022 | $20,118 | $97,468 | $15,591 | $81,877 |
| 2021 | $15,869 | $69,783 | $10,394 | $59,389 |
| 2020 | $15,462 | $69,783 | $10,394 | $59,389 |
| 2019 | $21,710 | $102,592 | $10,394 | $92,198 |
| 2018 | $19,337 | $88,799 | $9,094 | $79,705 |
| 2017 | $17,531 | $88,799 | $9,094 | $79,705 |
| 2016 | $17,741 | $88,799 | $9,094 | $79,705 |
| 2015 | $16,404 | $80,436 | $7,795 | $72,641 |
| 2014 | $16,330 | $80,436 | $7,795 | $72,641 |
| 2013 | $15,578 | $80,436 | $7,795 | $72,641 |
Source: Public Records
Map
Nearby Homes
- 40 Watergate Dr
- 44 Watergate Dr
- 38 Watergate Dr
- 43 Watergate Dr
- 48 Watergate Dr
- 2 Headwater Cove
- 13 Revere Dr
- 36 Watergate Dr
- 11 Revere Dr Unit 2
- 35 Watergate Dr
- 15 Revere Dr
- 4 Headwater Cove
- 34 Watergate Dr
- 9 Revere Dr
- 17 Revere Dr
- 3 Headwater Cove
- 33 Watergate Dr
- 50 Watergate Dr
- 5 Headwater Cove
- 30 Watergate Dr