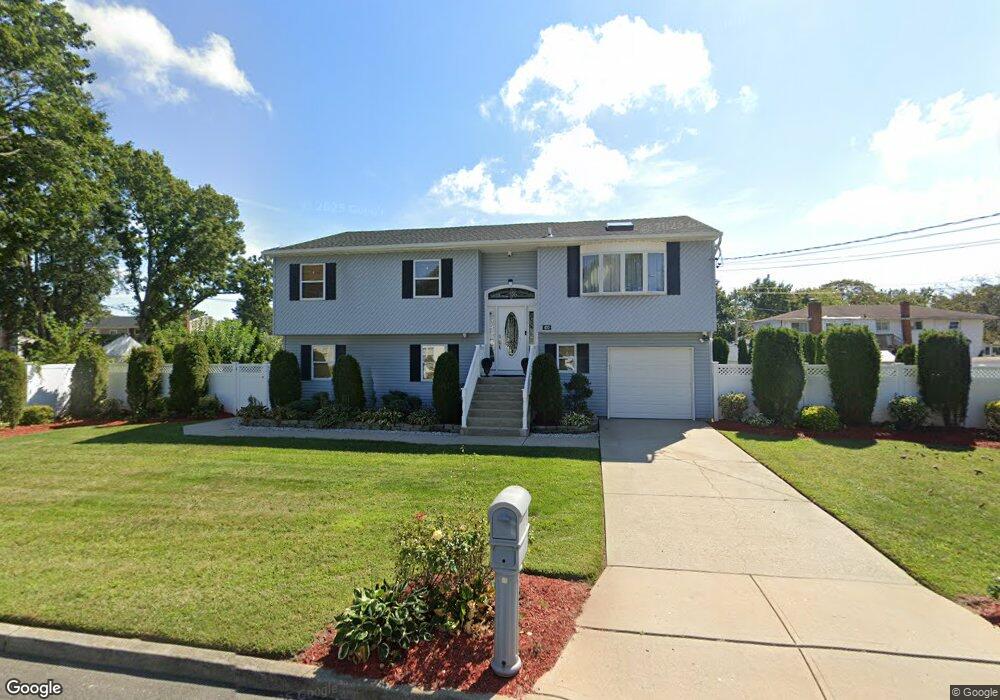
420 46th St Copiague, NY 11726
Estimated Value: $597,826 - $682,000
--
Bed
--
Bath
2,249
Sq Ft
$282/Sq Ft
Est. Value
About This Home
This home is located at 420 46th St, Copiague, NY 11726 and is currently estimated at $633,957, approximately $281 per square foot. 420 46th St is a home located in Suffolk County with nearby schools including Copiague Middle School, Walter G O Connell Copiague High School, and Copiague Christian Academy.
Ownership History
Date
Name
Owned For
Owner Type
Purchase Details
Closed on
Oct 26, 2020
Sold by
Faulbaher David M and Engley Danielle M
Bought by
Ciappa Jese and Ciappa Jodiann
Current Estimated Value
Home Financials for this Owner
Home Financials are based on the most recent Mortgage that was taken out on this home.
Original Mortgage
$432,437
Outstanding Balance
$384,807
Interest Rate
2.8%
Mortgage Type
FHA
Estimated Equity
$249,150
Purchase Details
Closed on
Sep 17, 2013
Sold by
Feaster William and Feaster Becky
Bought by
Feaster Becky
Purchase Details
Closed on
Oct 23, 2007
Sold by
Phillips Rita
Bought by
John Frank Devlp Corp
Purchase Details
Closed on
Aug 27, 1997
Sold by
Gkw Construction & Realty Corp
Bought by
Feaster William and Feaster Becky
Purchase Details
Closed on
May 8, 1997
Sold by
Cannon Charles
Bought by
Gkw Construction & Realty Corp
Create a Home Valuation Report for This Property
The Home Valuation Report is an in-depth analysis detailing your home's value as well as a comparison with similar homes in the area
Home Values in the Area
Average Home Value in this Area
Purchase History
| Date | Buyer | Sale Price | Title Company |
|---|---|---|---|
| Ciappa Jese | $445,000 | None Available | |
| Feaster Becky | -- | -- | |
| Feaster Becky | -- | -- | |
| John Frank Devlp Corp | $100,000 | Cl Margohn | |
| Feaster William | $161,000 | -- | |
| Feaster William | $161,000 | -- | |
| Gkw Construction & Realty Corp | $25,000 | -- | |
| Gkw Construction & Realty Corp | $25,000 | -- |
Source: Public Records
Mortgage History
| Date | Status | Borrower | Loan Amount |
|---|---|---|---|
| Open | Ciappa Jese | $432,437 |
Source: Public Records
Tax History Compared to Growth
Tax History
| Year | Tax Paid | Tax Assessment Tax Assessment Total Assessment is a certain percentage of the fair market value that is determined by local assessors to be the total taxable value of land and additions on the property. | Land | Improvement |
|---|---|---|---|---|
| 2024 | $11,518 | $3,530 | $250 | $3,280 |
| 2023 | $11,518 | $3,530 | $250 | $3,280 |
| 2022 | $11,583 | $3,530 | $250 | $3,280 |
| 2021 | $11,583 | $3,530 | $250 | $3,280 |
| 2020 | $10,532 | $3,530 | $250 | $3,280 |
| 2019 | $10,532 | $3,530 | $250 | $3,280 |
| 2018 | -- | $4,040 | $250 | $3,790 |
| 2017 | $11,514 | $4,040 | $250 | $3,790 |
| 2016 | $11,430 | $4,040 | $250 | $3,790 |
| 2015 | -- | $4,040 | $250 | $3,790 |
| 2014 | -- | $4,040 | $250 | $3,790 |
Source: Public Records
Map
Nearby Homes