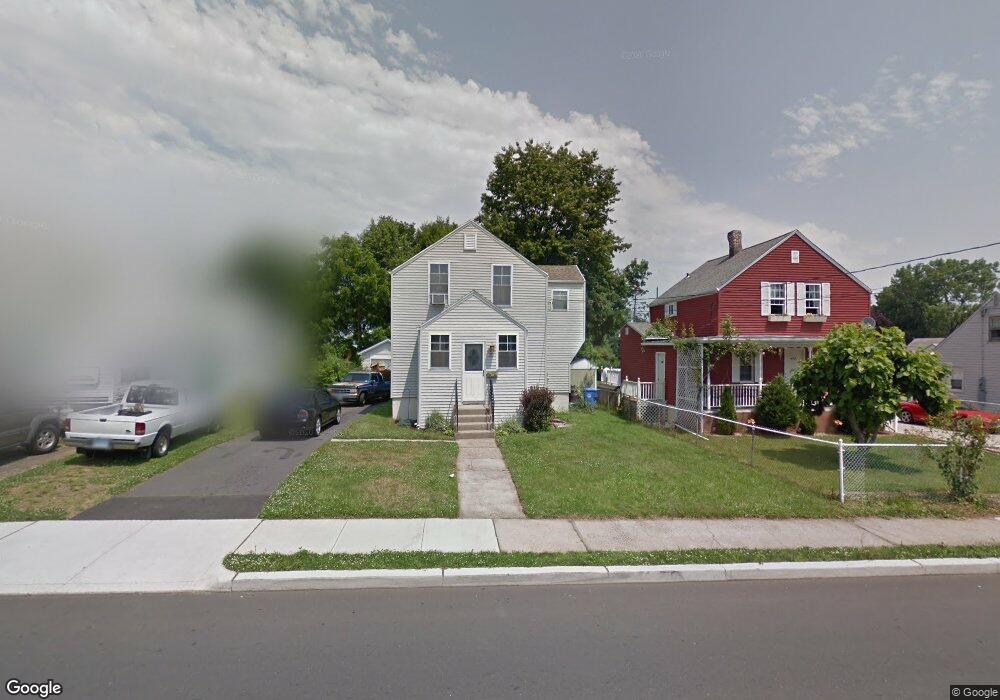
420 Ellis St New Britain, CT 06051
Estimated Value: $202,000 - $276,000
3
Beds
1
Bath
926
Sq Ft
$272/Sq Ft
Est. Value
About This Home
This home is located at 420 Ellis St, New Britain, CT 06051 and is currently estimated at $251,720, approximately $271 per square foot. 420 Ellis St is a home located in Hartford County with nearby schools including Slade Middle School, Raymond Hill School, and Mountain Laurel Sudbury School.
Ownership History
Date
Name
Owned For
Owner Type
Purchase Details
Closed on
Oct 3, 2008
Sold by
Pinnacle Dev Grp Llc
Bought by
Alfonso Sarah D
Current Estimated Value
Home Financials for this Owner
Home Financials are based on the most recent Mortgage that was taken out on this home.
Original Mortgage
$150,000
Outstanding Balance
$95,980
Interest Rate
6.54%
Estimated Equity
$155,740
Purchase Details
Closed on
Aug 13, 2008
Sold by
Pinnacle Dev Grp Llc
Bought by
Daifonso Sarah
Home Financials for this Owner
Home Financials are based on the most recent Mortgage that was taken out on this home.
Original Mortgage
$150,000
Outstanding Balance
$95,980
Interest Rate
6.54%
Estimated Equity
$155,740
Purchase Details
Closed on
Feb 13, 2007
Sold by
Est Robinson Mary S and Robinson Robert J
Bought by
Pinnacle Dev Group Llc
Create a Home Valuation Report for This Property
The Home Valuation Report is an in-depth analysis detailing your home's value as well as a comparison with similar homes in the area
Home Values in the Area
Average Home Value in this Area
Purchase History
| Date | Buyer | Sale Price | Title Company |
|---|---|---|---|
| Alfonso Sarah D | $150,000 | -- | |
| Daifonso Sarah | $150,000 | -- | |
| Pinnacle Dev Group Llc | $76,000 | -- |
Source: Public Records
Mortgage History
| Date | Status | Borrower | Loan Amount |
|---|---|---|---|
| Open | Pinnacle Dev Group Llc | $150,000 | |
| Previous Owner | Pinnacle Dev Group Llc | $150,000 |
Source: Public Records
Tax History Compared to Growth
Tax History
| Year | Tax Paid | Tax Assessment Tax Assessment Total Assessment is a certain percentage of the fair market value that is determined by local assessors to be the total taxable value of land and additions on the property. | Land | Improvement |
|---|---|---|---|---|
| 2025 | $4,270 | $108,990 | $35,490 | $73,500 |
| 2024 | $4,315 | $108,990 | $35,490 | $73,500 |
| 2023 | $4,172 | $108,990 | $35,490 | $73,500 |
| 2022 | $3,534 | $71,400 | $16,310 | $55,090 |
| 2021 | $3,534 | $71,400 | $16,310 | $55,090 |
| 2020 | $3,606 | $71,400 | $16,310 | $55,090 |
| 2019 | $3,606 | $71,400 | $16,310 | $55,090 |
| 2018 | $3,606 | $71,400 | $16,310 | $55,090 |
| 2017 | $3,196 | $63,280 | $16,310 | $46,970 |
| 2016 | $3,196 | $63,280 | $16,310 | $46,970 |
| 2015 | $3,101 | $63,280 | $16,310 | $46,970 |
| 2014 | $3,101 | $63,280 | $16,310 | $46,970 |
Source: Public Records
Map
Nearby Homes