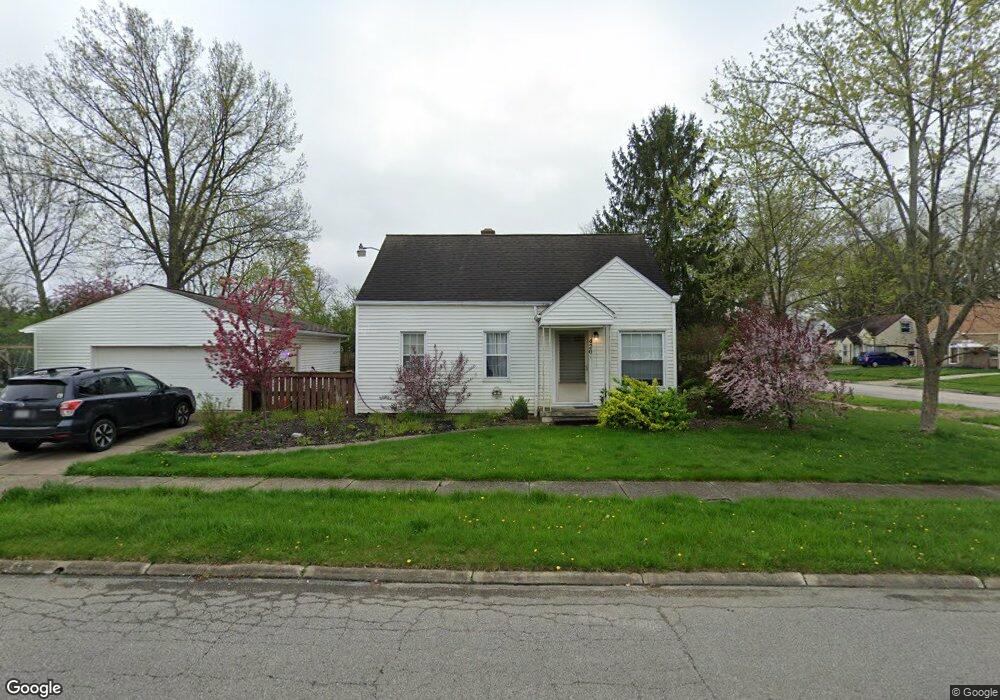
420 Madison Ave Cuyahoga Falls, OH 44221
Mud Brook NeighborhoodEstimated Value: $186,078 - $205,000
3
Beds
1
Bath
1,008
Sq Ft
$192/Sq Ft
Est. Value
About This Home
This home is located at 420 Madison Ave, Cuyahoga Falls, OH 44221 and is currently estimated at $193,270, approximately $191 per square foot. 420 Madison Ave is a home located in Summit County with nearby schools including Lincoln Elementary School, Roberts Middle School, and Cuyahoga Falls High School.
Ownership History
Date
Name
Owned For
Owner Type
Purchase Details
Closed on
Feb 8, 2018
Sold by
Presutti Stephen J and Roxbury Kimberly A
Bought by
Roxbury Kimberly A
Current Estimated Value
Purchase Details
Closed on
Apr 22, 2005
Sold by
Presuti Jack and Presutti Virginia Kaye
Bought by
Presutti Stephen J and Roxbury Kimberly A
Home Financials for this Owner
Home Financials are based on the most recent Mortgage that was taken out on this home.
Original Mortgage
$99,200
Outstanding Balance
$52,119
Interest Rate
6.06%
Mortgage Type
Fannie Mae Freddie Mac
Estimated Equity
$141,151
Purchase Details
Closed on
Jan 30, 2003
Sold by
Rowland Crystal L
Bought by
Presutti Jack
Purchase Details
Closed on
Sep 21, 1995
Sold by
Korb David A
Bought by
Rowland Crystal L
Home Financials for this Owner
Home Financials are based on the most recent Mortgage that was taken out on this home.
Original Mortgage
$82,802
Interest Rate
7.78%
Mortgage Type
FHA
Create a Home Valuation Report for This Property
The Home Valuation Report is an in-depth analysis detailing your home's value as well as a comparison with similar homes in the area
Home Values in the Area
Average Home Value in this Area
Purchase History
| Date | Buyer | Sale Price | Title Company |
|---|---|---|---|
| Roxbury Kimberly A | -- | None Available | |
| Presutti Stephen J | $124,000 | Land America-Lawyers Title | |
| Presutti Jack | $85,100 | -- | |
| Rowland Crystal L | $83,000 | -- |
Source: Public Records
Mortgage History
| Date | Status | Borrower | Loan Amount |
|---|---|---|---|
| Open | Presutti Stephen J | $99,200 | |
| Previous Owner | Rowland Crystal L | $82,802 | |
| Closed | Presutti Stephen J | $24,800 |
Source: Public Records
Tax History Compared to Growth
Tax History
| Year | Tax Paid | Tax Assessment Tax Assessment Total Assessment is a certain percentage of the fair market value that is determined by local assessors to be the total taxable value of land and additions on the property. | Land | Improvement |
|---|---|---|---|---|
| 2025 | $2,815 | $50,974 | $11,536 | $39,438 |
| 2024 | $2,815 | $50,974 | $11,536 | $39,438 |
| 2023 | $2,815 | $50,974 | $11,536 | $39,438 |
| 2022 | $2,608 | $38,392 | $8,544 | $29,848 |
| 2021 | $2,608 | $38,392 | $8,544 | $29,848 |
| 2020 | $2,566 | $38,390 | $8,540 | $29,850 |
| 2019 | $2,440 | $33,250 | $8,200 | $25,050 |
| 2018 | $2,027 | $33,250 | $8,200 | $25,050 |
| 2017 | $1,758 | $33,250 | $8,200 | $25,050 |
| 2016 | $1,759 | $29,230 | $8,200 | $21,030 |
| 2015 | $1,758 | $29,230 | $8,200 | $21,030 |
| 2014 | $1,759 | $29,230 | $8,200 | $21,030 |
| 2013 | $1,806 | $30,270 | $8,200 | $22,070 |
Source: Public Records
Map
Nearby Homes
- 418 Hayes Ave
- 324 Madison Ave
- 3166 7th St
- 242 Monroe Ave
- 3119 Meier Place
- 223 Filmore Ave
- 3044 Bailey Rd
- 3106 Prior Dr
- 2873 Oakwood Dr
- 2876 9th St
- 336 Graham Rd
- 2890 Bailey Rd
- 921 Lincoln Ave
- 3452 Wyoga Lake Rd
- 2762 Elmwood St
- 306 Hollywood Ave
- 2736 Maplewood St
- 2886 Norwood St
- 2835 Bailey Rd
- 823 Washington Ave
- 3155 Oakwood Dr
- 3149 Oakwood Dr
- 412 Madison Ave
- 421 Madison Ave
- 3143 Oakwood Dr
- 406 Madison Ave
- 3177 Oakwood Dr
- 413 Madison Ave
- 413 Adams Ave
- 421 Adams Ave
- 407 Madison Ave
- 400 Madison Ave
- 3183 Oakwood Dr
- 3162 Oakwood Dr
- 3156 Oakwood Dr
- 407 Adams Ave
- 3172 Oakwood Dr
- 3150 Oakwood Dr
- 401 Madison Ave
- 3189 Oakwood Dr