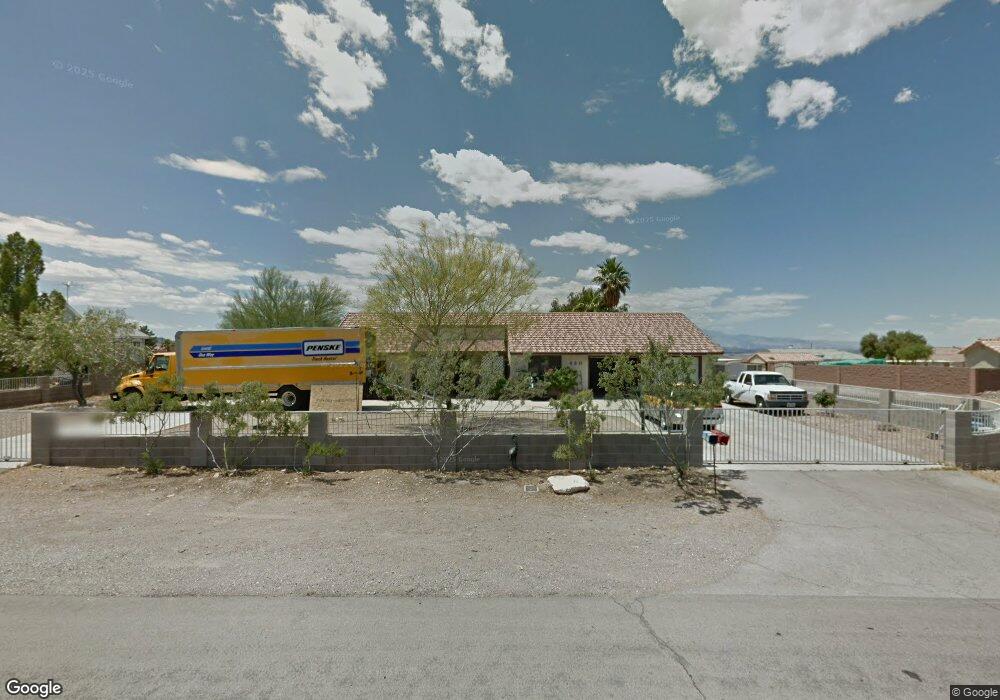
420 N Lisbon St Henderson, NV 89015
Foothills NeighborhoodEstimated Value: $511,512 - $721,000
3
Beds
3
Baths
1,708
Sq Ft
$351/Sq Ft
Est. Value
About This Home
This home is located at 420 N Lisbon St, Henderson, NV 89015 and is currently estimated at $599,128, approximately $350 per square foot. 420 N Lisbon St is a home located in Clark County with nearby schools including C T Sewell Elementary School, B Mahlon Brown Academy of International Studies, and Basic Academy of International Studies.
Ownership History
Date
Name
Owned For
Owner Type
Purchase Details
Closed on
Apr 18, 2016
Sold by
Chappell Scott
Bought by
Chappell Scott and Chappell Karlene
Current Estimated Value
Create a Home Valuation Report for This Property
The Home Valuation Report is an in-depth analysis detailing your home's value as well as a comparison with similar homes in the area
Home Values in the Area
Average Home Value in this Area
Purchase History
| Date | Buyer | Sale Price | Title Company |
|---|---|---|---|
| Chappell Scott | -- | None Available |
Source: Public Records
Tax History Compared to Growth
Tax History
| Year | Tax Paid | Tax Assessment Tax Assessment Total Assessment is a certain percentage of the fair market value that is determined by local assessors to be the total taxable value of land and additions on the property. | Land | Improvement |
|---|---|---|---|---|
| 2025 | $2,480 | $120,203 | $63,000 | $57,203 |
| 2024 | $2,409 | $120,203 | $63,000 | $57,203 |
| 2023 | $2,409 | $110,715 | $56,000 | $54,715 |
| 2022 | $2,452 | $99,303 | $49,000 | $50,303 |
| 2021 | $2,271 | $93,690 | $45,500 | $48,190 |
| 2020 | $2,105 | $95,291 | $47,250 | $48,041 |
| 2019 | $1,973 | $87,898 | $40,250 | $47,648 |
| 2018 | $1,883 | $72,583 | $26,250 | $46,333 |
| 2017 | $2,081 | $71,782 | $24,500 | $47,282 |
| 2016 | $1,763 | $72,288 | $24,500 | $47,788 |
| 2015 | $1,759 | $59,124 | $17,500 | $41,624 |
| 2014 | $1,707 | $57,190 | $17,500 | $39,690 |
Source: Public Records
Map
Nearby Homes