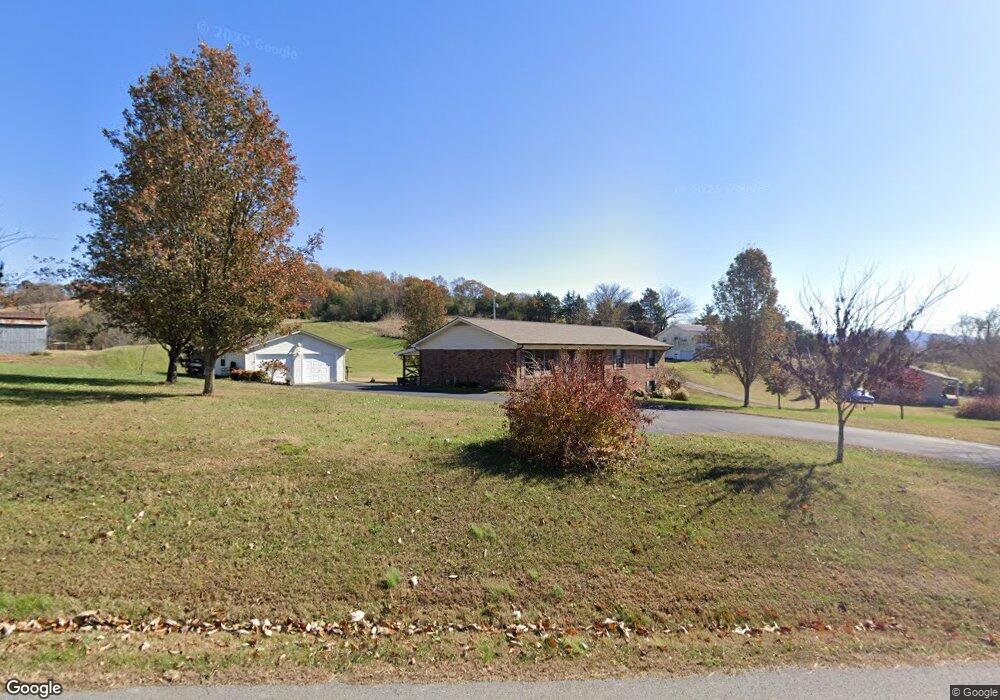
420 Tater Hill Rd Bean Station, TN 37708
Estimated Value: $240,000 - $429,000
--
Bed
1
Bath
1,556
Sq Ft
$215/Sq Ft
Est. Value
About This Home
This home is located at 420 Tater Hill Rd, Bean Station, TN 37708 and is currently estimated at $334,600, approximately $215 per square foot. 420 Tater Hill Rd is a home located in Grainger County with nearby schools including Bean Station Elementary School, Rutledge Middle School, and Grainger High School.
Ownership History
Date
Name
Owned For
Owner Type
Purchase Details
Closed on
Mar 24, 2022
Sold by
Long David C and Long Gracie D
Bought by
Long Gracie D and Long Michael Kyle
Current Estimated Value
Purchase Details
Closed on
Jun 21, 2007
Sold by
Mcelhaney James D
Bought by
Long David
Home Financials for this Owner
Home Financials are based on the most recent Mortgage that was taken out on this home.
Original Mortgage
$167,114
Interest Rate
6.35%
Mortgage Type
Cash
Purchase Details
Closed on
Oct 19, 2006
Sold by
Witt Wilburn
Bought by
Mcelhaney James D
Purchase Details
Closed on
Mar 17, 1999
Purchase Details
Closed on
Jul 17, 1997
Bought by
Witt Wilburn and Witt Wilma
Purchase Details
Closed on
Jul 2, 1979
Bought by
Mcelhaney James
Create a Home Valuation Report for This Property
The Home Valuation Report is an in-depth analysis detailing your home's value as well as a comparison with similar homes in the area
Home Values in the Area
Average Home Value in this Area
Purchase History
| Date | Buyer | Sale Price | Title Company |
|---|---|---|---|
| Long Gracie D | -- | Wolfenbarger S Lane | |
| Long David | $165,000 | -- | |
| Mcelhaney James D | $140,000 | -- | |
| -- | $1,000 | -- | |
| Witt Wilburn | $85,000 | -- | |
| Mcelhaney James | -- | -- |
Source: Public Records
Mortgage History
| Date | Status | Borrower | Loan Amount |
|---|---|---|---|
| Previous Owner | Mcelhaney James | $167,114 |
Source: Public Records
Tax History Compared to Growth
Tax History
| Year | Tax Paid | Tax Assessment Tax Assessment Total Assessment is a certain percentage of the fair market value that is determined by local assessors to be the total taxable value of land and additions on the property. | Land | Improvement |
|---|---|---|---|---|
| 2025 | $1,069 | $45,475 | $0 | $0 |
| 2024 | $1,069 | $45,475 | $7,625 | $37,850 |
| 2023 | $1,069 | $45,475 | $7,625 | $37,850 |
| 2022 | $1,044 | $45,475 | $7,625 | $37,850 |
| 2021 | $1,044 | $45,475 | $7,625 | $37,850 |
| 2020 | $881 | $45,475 | $7,625 | $37,850 |
| 2019 | $881 | $31,450 | $7,625 | $23,825 |
| 2018 | $761 | $31,450 | $7,625 | $23,825 |
| 2017 | $761 | $31,450 | $7,625 | $23,825 |
| 2016 | $761 | $31,450 | $7,625 | $23,825 |
| 2015 | $732 | $31,450 | $7,625 | $23,825 |
| 2014 | $732 | $29,292 | $0 | $0 |
Source: Public Records
Map
Nearby Homes
- 4066 Lakeshore Dr
- 1607 Tater Hill Rd
- 141 Twin Church Rd
- 6031 Lakeshore Dr
- 424 Sandpiper Ln
- 1793 Cherokee Dr
- 222 Sandpiper Ln
- 112 Sandpiper Ln
- 840 Gilmore Rd
- 2515 Lakeshore Rd
- 329 Shady Glen Ln
- TBD Rhondas Way
- 199 Honey Creek Ln
- Lot 157 Hoppers Bluff
- Lot 158 Hoppers Bluff
- Lot 11 Shields Crossing Dr
- 0 Rhondas Way
- 488 Masters Ln
- 270 Linda Cir
- 5438 U S 11w
- 384 Tater Hill Rd
- 384 Tater Hill Rd
- 445 Tater Hill Rd
- 431 Tater Hill Rd
- 379 Tater Hill Rd
- 514 Tater Hill Rd
- 546 Tater Hill Rd
- 1319 Blanken Dr
- 276 Tater Hill Rd
- 590 Tater Hill Rd
- 595 Tater Hill Rd
- 160 Kyle Long Rd
- 170 Kyle Long Rd
- 250 Tater Hill Rd
- 250 Tater Hill Rd
- 178 Kyle Long Rd
- 665 Tater Hill Rd
- 1211 Blanken Dr
- 0 00 Lakeshore Dr Unit RTC2833245
- 0 00 Lakeshore Dr Unit 1254061