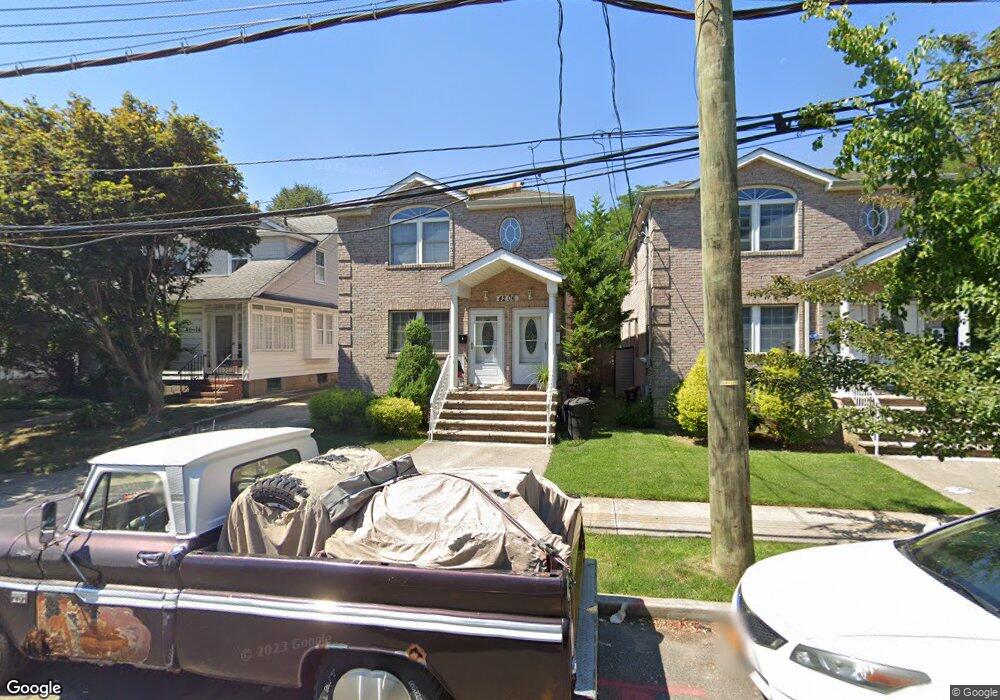
4206 216th St Bayside, NY 11361
Bayside NeighborhoodEstimated Value: $1,557,000 - $2,422,000
--
Bed
--
Bath
2,500
Sq Ft
$755/Sq Ft
Est. Value
About This Home
This home is located at 4206 216th St, Bayside, NY 11361 and is currently estimated at $1,888,735, approximately $755 per square foot. 4206 216th St is a home located in Queens County with nearby schools including P.S. 31 - Bayside, M.S. 158 - Marie Curie, and Bayside High School.
Ownership History
Date
Name
Owned For
Owner Type
Purchase Details
Closed on
Jun 4, 2024
Sold by
Estate Of Yoon Jin Kim and Ho As Administator
Bought by
Ho As Property Guardian James and Ho
Current Estimated Value
Purchase Details
Closed on
Jun 27, 2014
Sold by
Kim Chul Hoe
Bought by
Kim Chul Hoe and Kim Yoon Jin
Home Financials for this Owner
Home Financials are based on the most recent Mortgage that was taken out on this home.
Original Mortgage
$3,860
Interest Rate
4.18%
Mortgage Type
Commercial
Purchase Details
Closed on
Aug 30, 2007
Sold by
42-12 216Th Street Llc
Bought by
Kim Chulhoe
Home Financials for this Owner
Home Financials are based on the most recent Mortgage that was taken out on this home.
Original Mortgage
$712,500
Interest Rate
6.7%
Mortgage Type
Purchase Money Mortgage
Create a Home Valuation Report for This Property
The Home Valuation Report is an in-depth analysis detailing your home's value as well as a comparison with similar homes in the area
Home Values in the Area
Average Home Value in this Area
Purchase History
| Date | Buyer | Sale Price | Title Company |
|---|---|---|---|
| Ho As Property Guardian James | -- | -- | |
| Ho As Property Guardian James | -- | -- | |
| Kim Chul Hoe | -- | -- | |
| Kim Chul Hoe | -- | -- | |
| Kim Chulhoe | $950,000 | -- | |
| Kim Chulhoe | $950,000 | -- |
Source: Public Records
Mortgage History
| Date | Status | Borrower | Loan Amount |
|---|---|---|---|
| Previous Owner | Kim Chul Hoe | $3,860 | |
| Previous Owner | Kim Chulhoe | $47,500 | |
| Previous Owner | Kim Chulhoe | $712,500 |
Source: Public Records
Tax History Compared to Growth
Tax History
| Year | Tax Paid | Tax Assessment Tax Assessment Total Assessment is a certain percentage of the fair market value that is determined by local assessors to be the total taxable value of land and additions on the property. | Land | Improvement |
|---|---|---|---|---|
| 2025 | $16,395 | $88,012 | $15,288 | $72,724 |
| 2024 | $16,677 | $83,030 | $16,471 | $66,559 |
| 2023 | $15,713 | $79,632 | $13,965 | $65,667 |
| 2022 | $15,131 | $94,920 | $17,520 | $77,400 |
| 2021 | $15,220 | $87,660 | $17,520 | $70,140 |
| 2020 | $15,229 | $85,560 | $17,520 | $68,040 |
| 2019 | $14,181 | $94,260 | $17,520 | $76,740 |
| 2018 | $13,230 | $66,360 | $17,520 | $48,840 |
| 2017 | $12,820 | $64,359 | $15,792 | $48,567 |
| 2016 | $11,972 | $64,359 | $15,792 | $48,567 |
| 2015 | $7,323 | $61,119 | $19,248 | $41,871 |
| 2014 | $7,323 | $57,660 | $19,500 | $38,160 |
Source: Public Records
Map
Nearby Homes
- 42-16 215th St
- 4218 217th St
- 45-41 215th St
- 42-19 214th Place
- 43-18 215th Place
- 4228 214th Place Unit 2A
- 218-12 43rd Ave Unit 2E
- 39-09 216th St
- 213-02 42nd Ave Unit 2A
- 214-35 39th Ave
- 214-31 39th Ave
- 38-33 215th St
- 214-39 39th Ave
- 38-29 216th St
- 38-40 215th St
- 42-23 212th St Unit 3B
- 42-23 212th St Unit 3-C
- 217-19 39th Ave
- 43-27 220th St
- 4550 218th St
- 42-14 216th St
- 4208 216th St
- 4214 216th St
- 42-06 216th St
- 4218 216th St
- 4218 216th St
- 42-18 216th St
- 4205 215th Place
- 4201 215th Place
- 4209 215th Place
- 42-05 215th Place Unit 1Fl
- 42-05 215th Place Unit 2Fl
- 42-05 215th Place
- 4211 215th Place
- 42-19 216th St
- 4211 215th Place
- 42-03 216th St
- 4215 216th St Unit 1st Fl
- 4215 216th St
- 4205 216th St