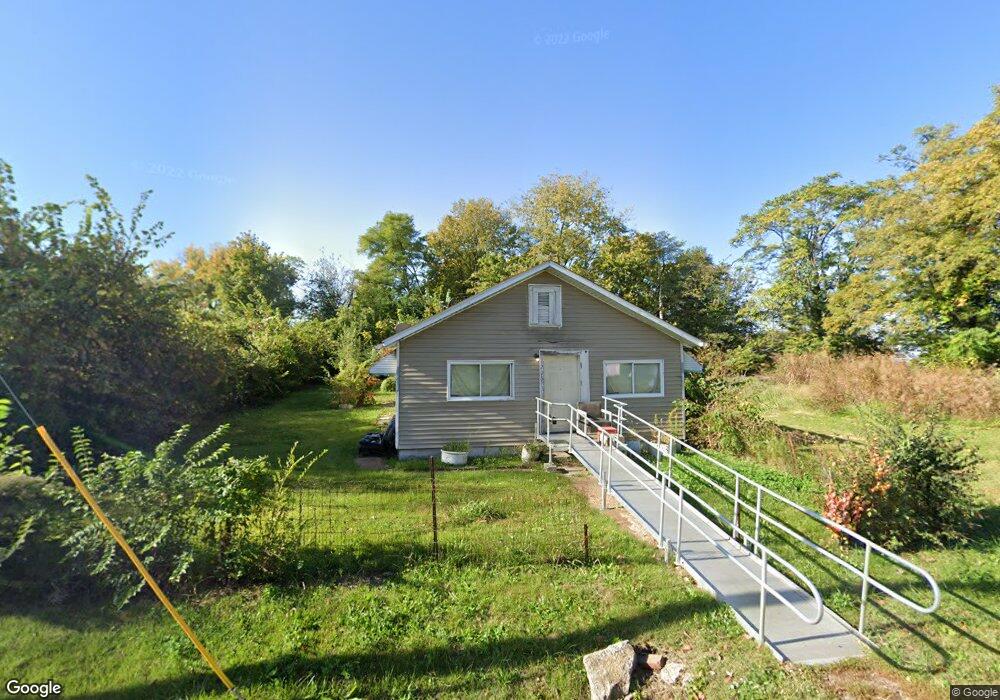
4206 Tudor Ave East Saint Louis, IL 62207
Estimated Value: $36,000 - $113,000
--
Bed
--
Bath
652
Sq Ft
$91/Sq Ft
Est. Value
About This Home
This home is located at 4206 Tudor Ave, East Saint Louis, IL 62207 and is currently estimated at $59,271, approximately $90 per square foot. 4206 Tudor Ave is a home located in St. Clair County with nearby schools including Annette Officer Elementary, East St Louis-Lincoln Middle School, and East St Louis Senior High School.
Ownership History
Date
Name
Owned For
Owner Type
Purchase Details
Closed on
Jul 28, 2025
Sold by
Bufford Kathy
Bought by
Moore Irma J
Current Estimated Value
Purchase Details
Closed on
Jul 1, 2024
Sold by
Bufford Willie E and Moore Irma J
Bought by
Moore Irma J and Bufford Kathy N
Purchase Details
Closed on
Oct 28, 2013
Sold by
Moore Irma J
Bought by
Moore Irma J and Bufford Kathy N
Purchase Details
Closed on
Oct 18, 2005
Sold by
Walker Vera Marcella
Bought by
Bufford Joseph H and Bufford Willie E
Purchase Details
Closed on
Jun 1, 2005
Sold by
Bufford Willie E
Bought by
Moore Irma Jean
Purchase Details
Closed on
Sep 16, 2002
Sold by
Bufford Joseph H
Bought by
Bufford Joseph H and Bufford Willie E
Purchase Details
Closed on
Nov 21, 2001
Sold by
Walker Vera Marcella
Bought by
Walker Vera Marcella
Purchase Details
Closed on
Aug 30, 1985
Sold by
Buford Emmett
Bought by
Buford Emmett and Bufford Joseph H
Create a Home Valuation Report for This Property
The Home Valuation Report is an in-depth analysis detailing your home's value as well as a comparison with similar homes in the area
Home Values in the Area
Average Home Value in this Area
Purchase History
| Date | Buyer | Sale Price | Title Company |
|---|---|---|---|
| Moore Irma J | -- | None Available | |
| Moore Irma J | -- | None Available | |
| Moore Irma J | -- | None Available | |
| Bufford Joseph H | -- | -- | |
| Moore Irma Jean | -- | -- | |
| Bufford Joseph H | -- | -- | |
| Walker Vera Marcella | -- | -- | |
| Buford Emmett | -- | -- |
Source: Public Records
Tax History Compared to Growth
Tax History
| Year | Tax Paid | Tax Assessment Tax Assessment Total Assessment is a certain percentage of the fair market value that is determined by local assessors to be the total taxable value of land and additions on the property. | Land | Improvement |
|---|---|---|---|---|
| 2024 | -- | $3,905 | $462 | $3,443 |
| 2023 | -- | $3,530 | $418 | $3,112 |
| 2022 | $0 | $3,093 | $366 | $2,727 |
| 2021 | $539 | $2,931 | $347 | $2,584 |
| 2020 | $0 | $2,621 | $364 | $2,257 |
| 2019 | $60 | $2,621 | $364 | $2,257 |
| 2018 | $0 | $2,659 | $369 | $2,290 |
| 2017 | $0 | $2,595 | $360 | $2,235 |
| 2016 | $0 | $2,973 | $359 | $2,614 |
| 2014 | $61 | $2,941 | $355 | $2,586 |
| 2013 | $48 | $2,759 | $333 | $2,426 |
Source: Public Records
Map
Nearby Homes
- 6330 Church Rd
- 1927 Bond Ave
- 604 West Ave
- 3325 Bond Ave
- 3300 Mccasland Ave
- 5413 Nelson Ave
- 2953 Virginia Place
- 2626 Missouri Ave
- 351 N 26th St
- 1997 Oak Tree Ln
- 3125 Louisiana Blvd
- 2274 Carol St
- 1415 S J St
- 2372 Lorraine Dr
- 1924 Bond Ave
- 1902 Baker Ave
- 2201 Gaty Ave
- 2014 Florence St
- 2416 Lorraine Dr
- 472 N 25th St