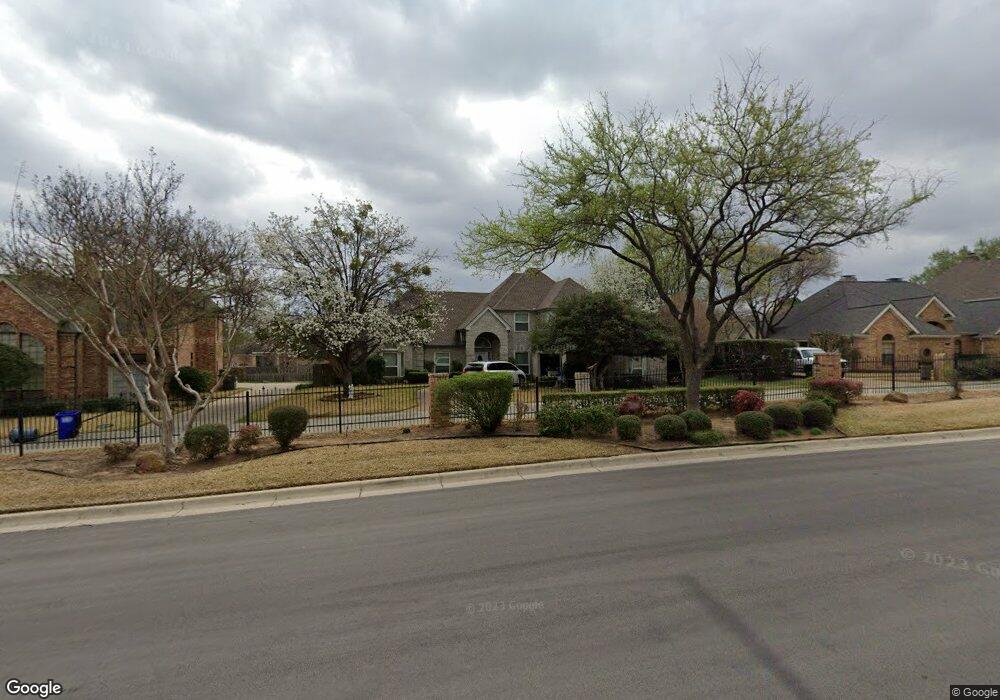
4207 Martin Pkwy Colleyville, TX 76034
Estimated Value: $704,000 - $820,000
3
Beds
2
Baths
2,757
Sq Ft
$277/Sq Ft
Est. Value
About This Home
This home is located at 4207 Martin Pkwy, Colleyville, TX 76034 and is currently estimated at $764,212, approximately $277 per square foot. 4207 Martin Pkwy is a home located in Tarrant County with nearby schools including Heritage Elementary School and Colleyville Middle School.
Ownership History
Date
Name
Owned For
Owner Type
Purchase Details
Closed on
Feb 5, 2025
Sold by
Bush Robert A
Bought by
Robert Bush Revocable Trust and Bush
Current Estimated Value
Purchase Details
Closed on
Aug 30, 2018
Sold by
Bush Maritta M
Bought by
Bush Robert A
Purchase Details
Closed on
Oct 27, 1995
Sold by
Wood Roy D and Wood Mary R
Bought by
Bush Robert A and Rush Maritta M
Home Financials for this Owner
Home Financials are based on the most recent Mortgage that was taken out on this home.
Original Mortgage
$160,000
Interest Rate
7.02%
Purchase Details
Closed on
May 27, 1994
Sold by
Owen Ross G and Owen Claudia J
Bought by
Wood Roy D and Wood Mary R
Home Financials for this Owner
Home Financials are based on the most recent Mortgage that was taken out on this home.
Original Mortgage
$130,000
Interest Rate
8.45%
Create a Home Valuation Report for This Property
The Home Valuation Report is an in-depth analysis detailing your home's value as well as a comparison with similar homes in the area
Home Values in the Area
Average Home Value in this Area
Purchase History
| Date | Buyer | Sale Price | Title Company |
|---|---|---|---|
| Robert Bush Revocable Trust | -- | None Listed On Document | |
| Bush Robert A | -- | None Available | |
| Bush Robert A | -- | American Title Company | |
| Wood Roy D | -- | American Title Company |
Source: Public Records
Mortgage History
| Date | Status | Borrower | Loan Amount |
|---|---|---|---|
| Previous Owner | Bush Robert A | $160,000 | |
| Previous Owner | Wood Roy D | $130,000 |
Source: Public Records
Tax History Compared to Growth
Tax History
| Year | Tax Paid | Tax Assessment Tax Assessment Total Assessment is a certain percentage of the fair market value that is determined by local assessors to be the total taxable value of land and additions on the property. | Land | Improvement |
|---|---|---|---|---|
| 2025 | $1,855 | $717,882 | $235,700 | $482,182 |
| 2024 | $1,855 | $717,882 | $235,700 | $482,182 |
| 2023 | $9,899 | $745,203 | $235,700 | $509,503 |
| 2022 | $10,537 | $533,492 | $235,700 | $297,792 |
| 2021 | $11,414 | $539,038 | $141,420 | $397,618 |
| 2020 | $10,499 | $478,467 | $141,420 | $337,047 |
| 2019 | $9,931 | $429,544 | $90,000 | $339,544 |
| 2018 | $1,849 | $428,763 | $90,000 | $338,763 |
| 2017 | $9,275 | $393,783 | $80,000 | $313,783 |
| 2016 | $8,432 | $356,914 | $80,000 | $276,914 |
| 2015 | $5,688 | $332,100 | $40,000 | $292,100 |
| 2014 | $5,688 | $332,100 | $40,000 | $292,100 |
Source: Public Records
Map
Nearby Homes
- 4300 Eaton Cir
- 4208 Lombardy Ct
- 3409 Langley Hill Ln
- 3516 Lejoie Ln
- 2904 Hickory Hill St
- 2904 Hickory Hill Ln
- 4001 Fairmont Ct
- 3409 Crescent Ct
- 3901 Campania Ct
- 2517 San Jacinto Dr
- 3909 Allendale St
- 3932 Cedar Ridge Dr
- 3112 Hazlewood Ct
- 3409 Crossgate Cir N
- 3013 Bent Tree Ln
- 3301 Queensbury Way W
- 3917 Autumn Ln
- 3713 Teal Ln
- 4106 Buckingham Place
- 4728 Cabernet Cir
- 4205 Martin Pkwy
- 4209 Martin Pkwy
- 4203 Martin Pkwy
- 4204 Pembrooke Pkwy W
- 4206 Pembrooke Pkwy W
- 4301 Martin Pkwy
- 3205 Carisbrooke Ct
- 4202 Pembrooke Pkwy W
- 4208 Pembrooke Pkwy W
- 4201 Martin Pkwy
- 3206 Carisbrooke Ct
- 4200 Pembrooke Pkwy W
- 3202 Cumberland Ct
- 4300 Pembrooke Pkwy W
- 3203 Carisbrooke Ct
- 3200 Scarborough Ln E
- 3204 Carisbrooke Ct
- 4305 Martin Pkwy
- 4302 Pembrooke Pkwy W
- 3300 Scarborough Lane Ct