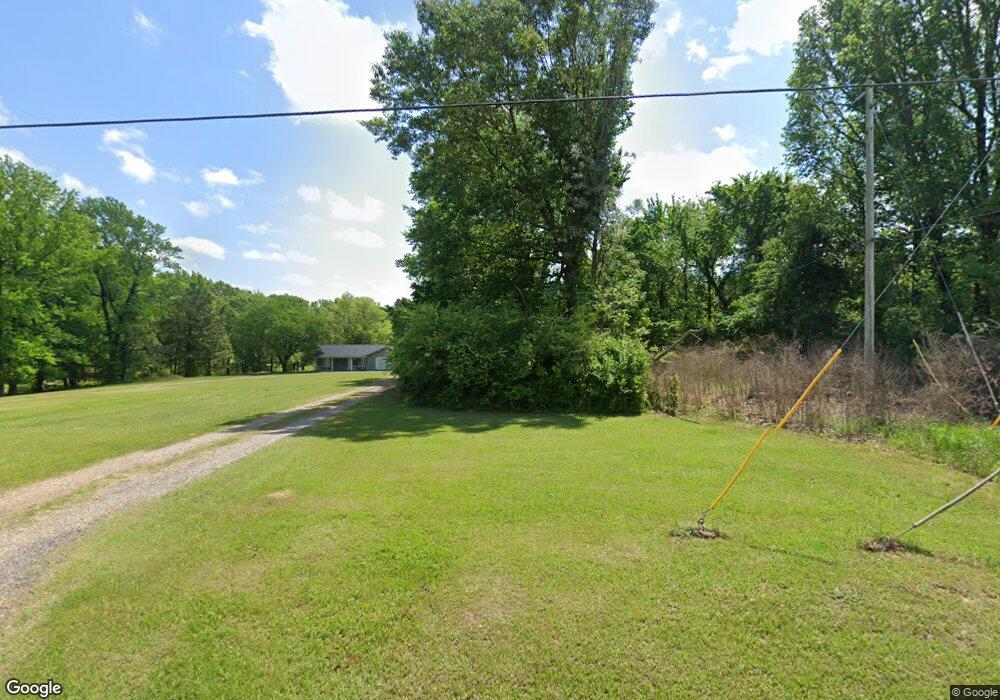
421 County Road 2311 Texarkana, TX 75503
Estimated Value: $253,000 - $282,000
2
Beds
2
Baths
1,578
Sq Ft
$169/Sq Ft
Est. Value
About This Home
This home is located at 421 County Road 2311, Texarkana, TX 75503 and is currently estimated at $267,175, approximately $169 per square foot. 421 County Road 2311 is a home located in Bowie County with nearby schools including Margaret Fischer Davis Elementary School, Pleasant Grove Intermediate School, and Pleasant Grove Middle School.
Ownership History
Date
Name
Owned For
Owner Type
Purchase Details
Closed on
Nov 13, 2023
Sold by
Baker Alexander Clayton and Baker Felicia Owens
Bought by
Marler Tadd Richmond and Marler Mandy Irene
Current Estimated Value
Home Financials for this Owner
Home Financials are based on the most recent Mortgage that was taken out on this home.
Original Mortgage
$240,206
Outstanding Balance
$235,803
Interest Rate
7.49%
Mortgage Type
FHA
Estimated Equity
$31,372
Purchase Details
Closed on
May 10, 2021
Sold by
Taylor Georgette and Estate Of George Raymond Hoove
Bought by
Baker Alexader Clayton and Owens Felicia
Home Financials for this Owner
Home Financials are based on the most recent Mortgage that was taken out on this home.
Original Mortgage
$178,002
Interest Rate
3.1%
Mortgage Type
VA
Create a Home Valuation Report for This Property
The Home Valuation Report is an in-depth analysis detailing your home's value as well as a comparison with similar homes in the area
Home Values in the Area
Average Home Value in this Area
Purchase History
| Date | Buyer | Sale Price | Title Company |
|---|---|---|---|
| Marler Tadd Richmond | -- | None Listed On Document | |
| Baker Alexader Clayton | -- | Capital Title |
Source: Public Records
Mortgage History
| Date | Status | Borrower | Loan Amount |
|---|---|---|---|
| Open | Marler Tadd Richmond | $240,206 | |
| Previous Owner | Baker Alexader Clayton | $178,002 |
Source: Public Records
Tax History Compared to Growth
Tax History
| Year | Tax Paid | Tax Assessment Tax Assessment Total Assessment is a certain percentage of the fair market value that is determined by local assessors to be the total taxable value of land and additions on the property. | Land | Improvement |
|---|---|---|---|---|
| 2025 | $2,670 | $246,748 | $50,188 | $196,560 |
| 2024 | $2,670 | $241,733 | $42,490 | $199,243 |
| 2023 | $3,772 | $226,587 | $42,490 | $184,097 |
| 2022 | $3,702 | $197,488 | $42,490 | $154,998 |
| 2021 | $3,342 | $167,677 | $42,490 | $125,187 |
| 2020 | $3,403 | $169,537 | $46,188 | $123,349 |
| 2019 | $3,439 | $165,649 | $46,188 | $119,461 |
| 2018 | $3,367 | $163,638 | $46,188 | $117,450 |
| 2017 | $3,332 | $162,162 | $46,188 | $115,974 |
| 2016 | $3,332 | $162,162 | $46,188 | $115,974 |
| 2015 | $1,899 | $159,025 | $46,188 | $112,837 |
| 2014 | $1,899 | $156,218 | $46,188 | $110,030 |
Source: Public Records
Map
Nearby Homes
- 142 Easy St
- 350 Blackhills
- 100 Yellowstone
- 300 Yellowstone
- 150 Bighorn
- 160 Bighorn
- 181 Bighorn
- 170 Bighorn
- TBD Richmond Rd
- 1.5 acres Richmond Rd
- 3656 Farm To Market Road 559
- Lot 2 Giovanni - Cooper Lane Estate III Dr
- 0 Holly Creek Rd
- 37 Leggett Dr
- 33 Leggett Dr
- 6814 Maple View Ln
- TBD Ffm 558
- 3810 Hunters Ridge
- TBD Lionel Ave
- 3809 Hunters Ridge
- 49 Roberta Ln
- 24 Easy St
- 463 County Road 2311
- 50 Roberta Ln
- 20 Easy St
- 149 Easy St
- 428 County Road 2311
- 0.73 Acres County Road 2311
- TBD County Road 2311
- 26 County Road 2312
- 9533 Fm 1397
- 9385 Fm 1397
- 136 Roberta Ln
- 230 Easy St
- 555 County Road 2311
- 705 County Road 2311
- 286 Easy St
- 274 Easy St
- 9305 Fm 1397
- 41 Mckinney Place