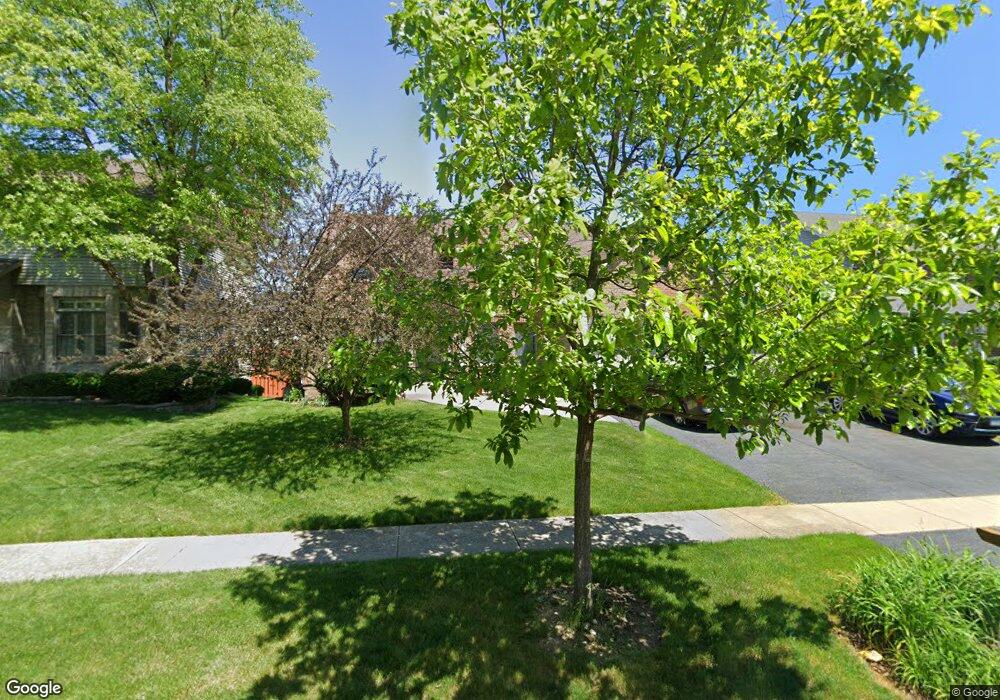
421 Sudbury Cir Oswego, IL 60543
South Oswego NeighborhoodEstimated Value: $504,000 - $541,000
4
Beds
3
Baths
2,858
Sq Ft
$183/Sq Ft
Est. Value
About This Home
This home is located at 421 Sudbury Cir, Oswego, IL 60543 and is currently estimated at $521,673, approximately $182 per square foot. 421 Sudbury Cir is a home located in Kendall County with nearby schools including Prairie Point Elementary School, Traughber Junior High School, and Oswego High School.
Ownership History
Date
Name
Owned For
Owner Type
Purchase Details
Closed on
Jan 6, 2010
Sold by
Us Bank National Association
Bought by
Hulsey Charles and Hulsey Janet
Current Estimated Value
Purchase Details
Closed on
Sep 3, 2009
Sold by
Kasuba Tom
Bought by
Us Bank National Association
Purchase Details
Closed on
Nov 23, 2005
Sold by
Kocour Laurie
Bought by
Kocour Mark S and Kocour Laurie
Home Financials for this Owner
Home Financials are based on the most recent Mortgage that was taken out on this home.
Original Mortgage
$356,250
Interest Rate
7.3%
Mortgage Type
New Conventional
Purchase Details
Closed on
Feb 18, 2005
Sold by
T J Baumgartner Custom Homes Corp
Bought by
Kasuba Tomas J
Home Financials for this Owner
Home Financials are based on the most recent Mortgage that was taken out on this home.
Original Mortgage
$302,373
Interest Rate
5%
Mortgage Type
Purchase Money Mortgage
Create a Home Valuation Report for This Property
The Home Valuation Report is an in-depth analysis detailing your home's value as well as a comparison with similar homes in the area
Home Values in the Area
Average Home Value in this Area
Purchase History
| Date | Buyer | Sale Price | Title Company |
|---|---|---|---|
| Hulsey Charles | $255,000 | First American Title | |
| Us Bank National Association | -- | None Available | |
| Kocour Mark S | -- | None Available | |
| Kasuba Tomas J | $378,000 | Chicago Title Insurance Co |
Source: Public Records
Mortgage History
| Date | Status | Borrower | Loan Amount |
|---|---|---|---|
| Previous Owner | Kocour Mark S | $356,250 | |
| Previous Owner | Kasuba Tomas J | $302,373 | |
| Closed | Kasuba Tomas J | $56,695 |
Source: Public Records
Tax History Compared to Growth
Tax History
| Year | Tax Paid | Tax Assessment Tax Assessment Total Assessment is a certain percentage of the fair market value that is determined by local assessors to be the total taxable value of land and additions on the property. | Land | Improvement |
|---|---|---|---|---|
| 2024 | $11,118 | $149,163 | $28,486 | $120,677 |
| 2023 | $9,992 | $132,003 | $25,209 | $106,794 |
| 2022 | $9,844 | $120,002 | $22,917 | $97,085 |
| 2021 | $9,466 | $112,152 | $21,418 | $90,734 |
| 2020 | $9,351 | $109,953 | $20,998 | $88,955 |
| 2019 | $9,251 | $107,362 | $20,998 | $86,364 |
| 2018 | $9,901 | $112,513 | $18,948 | $93,565 |
| 2017 | $9,653 | $105,152 | $17,708 | $87,444 |
| 2016 | $9,474 | $102,089 | $17,192 | $84,897 |
| 2015 | $9,718 | $100,087 | $16,855 | $83,232 |
| 2014 | -- | $97,172 | $16,364 | $80,808 |
| 2013 | -- | $97,172 | $16,364 | $80,808 |
Source: Public Records
Map
Nearby Homes
- 406 Windsor Dr
- 609 Chestnut Dr
- 482 Deerfield Dr
- 483 Deerfield Dr
- 538 Sudbury Cir
- 676 Cumberland Ln
- 668 Cumberland Ln
- 673 Cumberland Ln
- 777 Dartmouth Ln
- 770 Dartmouth Ln
- 315 White Pines Ln
- 851 Claridge Dr
- 639 Vista Dr
- 716 Pinehurst Ln
- 714 Pinehurst Ln
- 395 Danforth Dr
- 318 Monica Ln
- 2489 Semillon St
- 2486 Semillon St
- 2319 Hirsch Dr
- 423 Sudbury Cir
- 419 Sudbury Cir
- 447 Sudbury Cir Unit 7
- 425 Sudbury Cir Unit 7
- 417 Sudbury Cir Unit 7
- 445 Sudbury Cir
- 449 Sudbury Cir
- 443 Sudbury Cir
- 420 Sudbury Cir
- 422 Sudbury Cir
- 451 Sudbury Cir
- 418 Sudbury Cir
- 415 Sudbury Cir Unit 7
- 427 Sudbury Cir
- 424 Sudbury Cir
- 416 Sudbury Cir
- 441 Sudbury Cir Unit 7
- 453 Sudbury Cir
- 413 Sudbury Cir Unit 7
- 448 Sudbury Cir