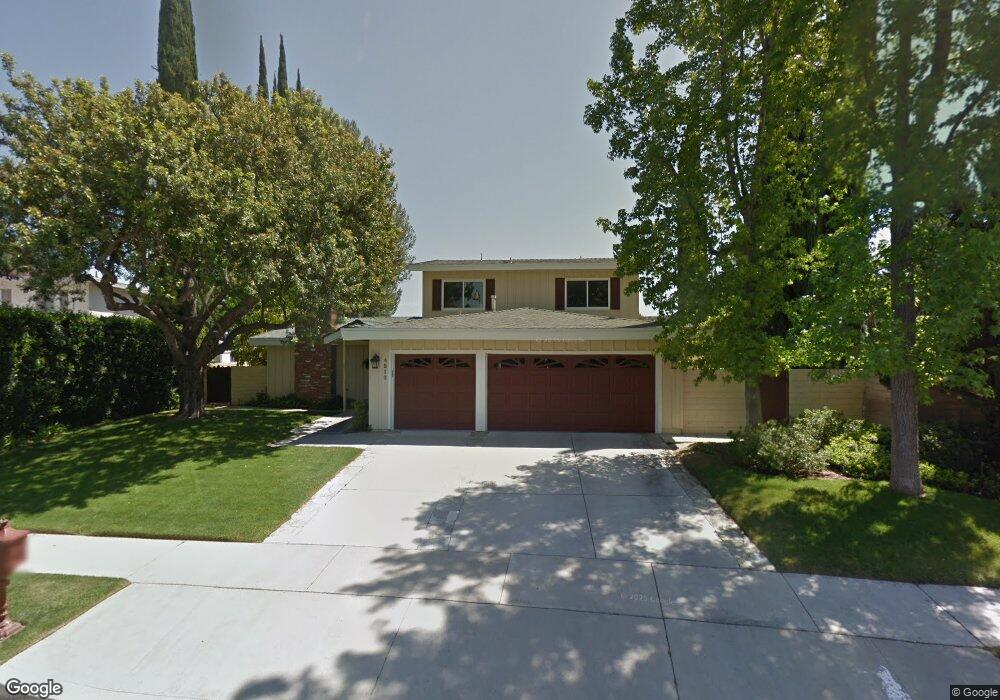
4212 Bon Homme Rd Calabasas, CA 91302
Estimated Value: $1,572,000 - $1,716,000
4
Beds
3
Baths
2,533
Sq Ft
$636/Sq Ft
Est. Value
About This Home
This home is located at 4212 Bon Homme Rd, Calabasas, CA 91302 and is currently estimated at $1,611,499, approximately $636 per square foot. 4212 Bon Homme Rd is a home located in Los Angeles County with nearby schools including Chaparral Elementary School, Alice C. Stelle Middle School, and Calabasas High School.
Ownership History
Date
Name
Owned For
Owner Type
Purchase Details
Closed on
Jan 4, 2008
Sold by
Snebold William G and Steinmetz Snebold Lisa A
Bought by
Snebold William G and Snebold Lisa Steinmetz
Current Estimated Value
Purchase Details
Closed on
Jul 24, 1996
Sold by
Sims Lori
Bought by
Snebold William G and Steinmetz Snebold Lisa A
Home Financials for this Owner
Home Financials are based on the most recent Mortgage that was taken out on this home.
Original Mortgage
$306,000
Outstanding Balance
$22,419
Interest Rate
8.39%
Estimated Equity
$1,589,080
Purchase Details
Closed on
May 30, 1996
Sold by
Sims Alan
Bought by
Snebold William G and Steinmetz Snebold Lisa A
Home Financials for this Owner
Home Financials are based on the most recent Mortgage that was taken out on this home.
Original Mortgage
$306,000
Outstanding Balance
$22,419
Interest Rate
8.39%
Estimated Equity
$1,589,080
Create a Home Valuation Report for This Property
The Home Valuation Report is an in-depth analysis detailing your home's value as well as a comparison with similar homes in the area
Home Values in the Area
Average Home Value in this Area
Purchase History
| Date | Buyer | Sale Price | Title Company |
|---|---|---|---|
| Snebold William G | -- | None Available | |
| Snebold William G | $170,000 | Investors Title Company | |
| Snebold William G | $170,000 | Investors Title Company |
Source: Public Records
Mortgage History
| Date | Status | Borrower | Loan Amount |
|---|---|---|---|
| Open | Snebold William G | $306,000 |
Source: Public Records
Tax History Compared to Growth
Tax History
| Year | Tax Paid | Tax Assessment Tax Assessment Total Assessment is a certain percentage of the fair market value that is determined by local assessors to be the total taxable value of land and additions on the property. | Land | Improvement |
|---|---|---|---|---|
| 2025 | $6,639 | $553,729 | $338,594 | $215,135 |
| 2024 | $6,639 | $542,872 | $331,955 | $210,917 |
| 2023 | $6,478 | $532,229 | $325,447 | $206,782 |
| 2022 | $6,238 | $521,794 | $319,066 | $202,728 |
| 2021 | $6,214 | $511,563 | $312,810 | $198,753 |
| 2019 | $6,001 | $496,392 | $303,533 | $192,859 |
| 2018 | $5,886 | $486,660 | $297,582 | $189,078 |
| 2016 | $5,572 | $467,765 | $286,028 | $181,737 |
| 2015 | $5,480 | $460,740 | $281,732 | $179,008 |
| 2014 | $5,418 | $451,716 | $276,214 | $175,502 |
Source: Public Records
Map
Nearby Homes
- 22612 Paul Revere Dr
- 22335 De Grasse Dr
- 22587 Waterbury St
- 4341 Freedom Dr Unit B
- 22666 Margarita Dr
- 22663 Margarita Dr
- 22244 Craft Ct
- 22552 Uhea Rd
- 4218 Manson Ave
- 4244 Balcony Dr
- 22528 Uhea Rd
- 22628 Quinta Rd
- 23112 Cass Ave
- 22505 Dardenne St
- 4610 Cerrillos Dr
- 4740 Excelente Dr
- 4201 Topanga Canyon Blvd Unit 61
- 4201 Topanga Canyon Blvd Unit 136
- 4201 Topanga Canyon Blvd Unit 189
- 4201 Topanga Canyon Blvd Unit 171
- 4220 Bon Homme Rd
- 22507 Peale Dr
- 22515 Peale Dr
- 22458 De Kalb Dr
- 4230 Bon Homme Rd
- 22464 De Kalb Dr
- 22450 De Kalb Dr
- 4209 Bon Homme Rd
- 22501 Peale Dr
- 22455 De Grasse Dr
- 4219 Bon Homme Rd
- 4240 Bon Homme Rd
- 4229 Bon Homme Rd
- 22500 Peale Dr
- 4191 Bon Homme Rd
- 22516 Peale Dr
- 22444 De Kalb Dr
- 22508 Peale Dr
- 22457 De Kalb Dr
- 22451 De Grasse Dr