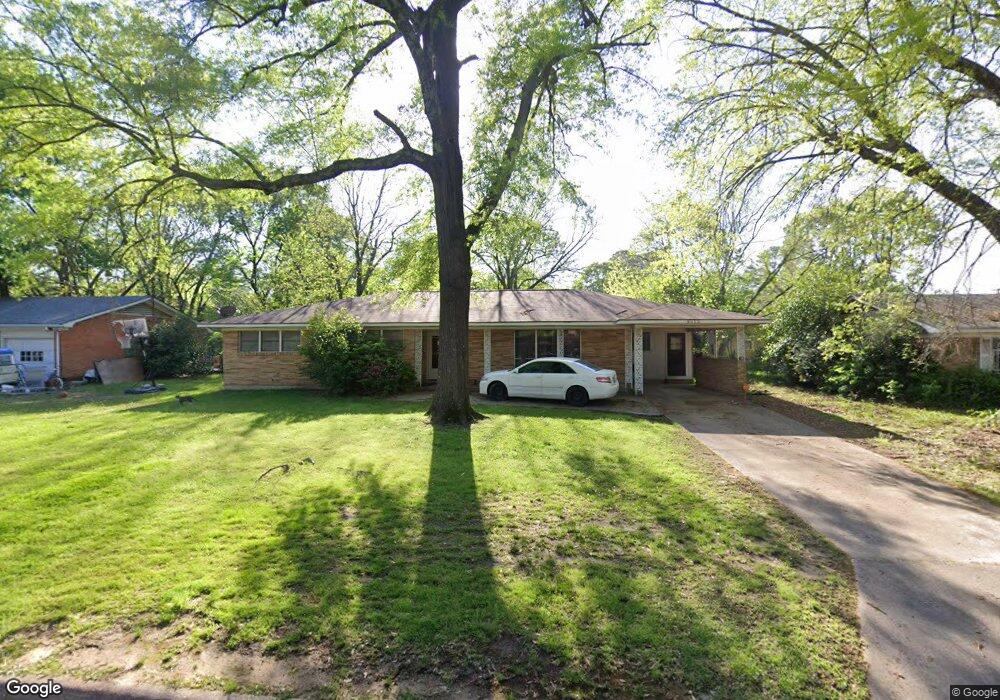
4213 Olive St Texarkana, TX 75503
Estimated Value: $190,000 - $199,000
--
Bed
--
Bath
2,078
Sq Ft
$93/Sq Ft
Est. Value
About This Home
This home is located at 4213 Olive St, Texarkana, TX 75503 and is currently estimated at $193,333, approximately $93 per square foot. 4213 Olive St is a home located in Bowie County with nearby schools including Spring Lake Park Elementary School, Texas Middle School, and Texas High School.
Ownership History
Date
Name
Owned For
Owner Type
Purchase Details
Closed on
Jun 24, 2025
Sold by
Fields Darrell L and Carthron Shirley Ann
Bought by
Fields Charles D
Current Estimated Value
Purchase Details
Closed on
Aug 31, 2013
Sold by
Fields Charles D
Bought by
Carthron Shirley A
Home Financials for this Owner
Home Financials are based on the most recent Mortgage that was taken out on this home.
Original Mortgage
$49,211
Interest Rate
3.94%
Mortgage Type
New Conventional
Purchase Details
Closed on
Feb 20, 2007
Sold by
Zhang Mei Yun and Chen Qi Bin
Bought by
Fields Charles D
Home Financials for this Owner
Home Financials are based on the most recent Mortgage that was taken out on this home.
Original Mortgage
$51,900
Interest Rate
6.17%
Mortgage Type
New Conventional
Create a Home Valuation Report for This Property
The Home Valuation Report is an in-depth analysis detailing your home's value as well as a comparison with similar homes in the area
Home Values in the Area
Average Home Value in this Area
Purchase History
| Date | Buyer | Sale Price | Title Company |
|---|---|---|---|
| Fields Charles D | -- | None Listed On Document | |
| Carthron Shirley A | -- | None Available | |
| Fields Charles D | -- | None Available |
Source: Public Records
Mortgage History
| Date | Status | Borrower | Loan Amount |
|---|---|---|---|
| Previous Owner | Fields Charles D | $49,211 | |
| Previous Owner | Fields Charles D | $51,900 |
Source: Public Records
Tax History Compared to Growth
Tax History
| Year | Tax Paid | Tax Assessment Tax Assessment Total Assessment is a certain percentage of the fair market value that is determined by local assessors to be the total taxable value of land and additions on the property. | Land | Improvement |
|---|---|---|---|---|
| 2025 | $983 | $172,152 | $12,500 | $159,652 |
| 2024 | $983 | $160,292 | $12,500 | $155,125 |
| 2023 | $3,450 | $145,720 | $0 | $0 |
| 2022 | $3,162 | $142,750 | $10,500 | $132,250 |
| 2021 | $3,080 | $120,430 | $10,500 | $109,930 |
| 2020 | $3,088 | $120,108 | $10,500 | $109,608 |
| 2019 | $3,067 | $114,967 | $10,500 | $104,467 |
| 2018 | $2,961 | $111,012 | $10,500 | $100,512 |
| 2017 | $2,901 | $109,077 | $10,500 | $98,577 |
| 2016 | $2,714 | $102,036 | $10,500 | $91,536 |
| 2015 | $1,908 | $101,147 | $10,500 | $90,647 |
| 2014 | $1,908 | $93,367 | $10,500 | $82,867 |
Source: Public Records
Map
Nearby Homes
- 4211 Olive St
- 4215 Olive St
- 4216 Elizabeth St
- 4218 Elizabeth St
- 4209 Olive St
- 4214 Elizabeth St
- 4220 Elizabeth St
- 4216 Olive St
- 0 Olive Unit 20030055
- 4212 Elizabeth St
- 4214 Olive St
- 4219 Olive St
- 4218 Olive St
- 4212 Olive St
- 4210 Elizabeth St
- 4207 Olive St
- 4224 Elizabeth St
- 4208 Elizabeth St
- 4210 Olive St
- 4226 Elizabeth St