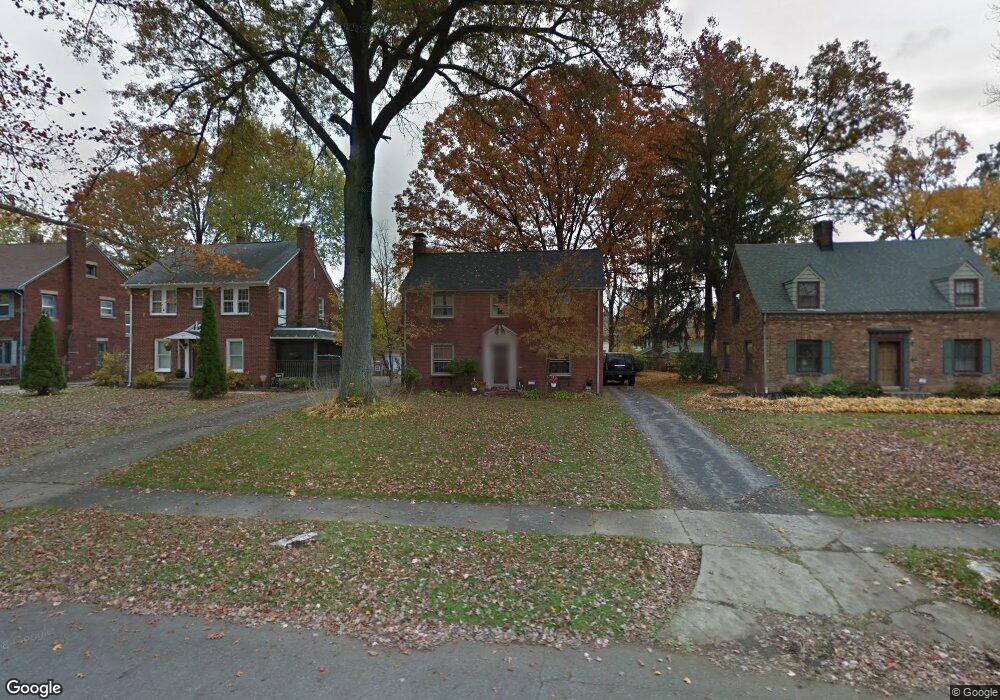
4221 Howard St Youngstown, OH 44512
Estimated Value: $125,855 - $150,000
3
Beds
3
Baths
1,740
Sq Ft
$78/Sq Ft
Est. Value
About This Home
This home is located at 4221 Howard St, Youngstown, OH 44512 and is currently estimated at $135,714, approximately $77 per square foot. 4221 Howard St is a home located in Mahoning County with nearby schools including Taft Elementary School, East High School, and Horizon Science Academy - Youngstown.
Ownership History
Date
Name
Owned For
Owner Type
Purchase Details
Closed on
Mar 24, 2006
Sold by
Empire Mtg Llc
Bought by
Johns Stacie R
Current Estimated Value
Home Financials for this Owner
Home Financials are based on the most recent Mortgage that was taken out on this home.
Original Mortgage
$60,000
Outstanding Balance
$31,254
Interest Rate
4.87%
Mortgage Type
Fannie Mae Freddie Mac
Estimated Equity
$104,460
Purchase Details
Closed on
Jan 24, 2006
Sold by
Palmer Bruce E and Palmer Marita R
Bought by
Empire Mtg Llc
Home Financials for this Owner
Home Financials are based on the most recent Mortgage that was taken out on this home.
Original Mortgage
$60,000
Outstanding Balance
$31,254
Interest Rate
4.87%
Mortgage Type
Fannie Mae Freddie Mac
Estimated Equity
$104,460
Purchase Details
Closed on
Mar 5, 1999
Sold by
Compound Melissa A and Salpin Melissa A
Bought by
Palmer Bruce E and Palmer Maribel R
Purchase Details
Closed on
Jun 22, 1990
Bought by
Galpin Melissa A
Create a Home Valuation Report for This Property
The Home Valuation Report is an in-depth analysis detailing your home's value as well as a comparison with similar homes in the area
Home Values in the Area
Average Home Value in this Area
Purchase History
| Date | Buyer | Sale Price | Title Company |
|---|---|---|---|
| Johns Stacie R | $60,000 | None Available | |
| Empire Mtg Llc | $48,000 | None Available | |
| Palmer Bruce E | $70,900 | -- | |
| Galpin Melissa A | -- | -- |
Source: Public Records
Mortgage History
| Date | Status | Borrower | Loan Amount |
|---|---|---|---|
| Open | Johns Stacie R | $60,000 |
Source: Public Records
Tax History Compared to Growth
Tax History
| Year | Tax Paid | Tax Assessment Tax Assessment Total Assessment is a certain percentage of the fair market value that is determined by local assessors to be the total taxable value of land and additions on the property. | Land | Improvement |
|---|---|---|---|---|
| 2024 | $1,165 | $24,460 | $2,140 | $22,320 |
| 2023 | $1,156 | $24,460 | $2,140 | $22,320 |
| 2022 | $1,192 | $19,420 | $2,160 | $17,260 |
| 2021 | $1,193 | $19,420 | $2,160 | $17,260 |
| 2020 | $1,199 | $19,420 | $2,160 | $17,260 |
| 2019 | $1,204 | $17,480 | $1,940 | $15,540 |
| 2018 | $1,215 | $17,480 | $1,940 | $15,540 |
| 2017 | $1,212 | $17,480 | $1,940 | $15,540 |
| 2016 | $1,245 | $19,310 | $2,330 | $16,980 |
| 2015 | $1,219 | $19,310 | $2,330 | $16,980 |
| 2014 | $1,210 | $19,310 | $2,330 | $16,980 |
| 2013 | $1,193 | $19,310 | $2,330 | $16,980 |
Source: Public Records
Map
Nearby Homes
- 4312 Helena Ave
- 4307 Helena Ave
- 30 Pinehurst Ave
- 4144 Helena Ave
- 4504 Southern Blvd
- 4508 Southern Blvd
- 60 Shadyside Dr
- 94 Shadyside Dr
- 94 Beechwood Dr
- 83 Beechwood Dr
- 3916 Howard St
- 4250 Oak Knoll Dr
- 28 Terrace Dr
- 204 Lowell Ave
- 148 Clifton Dr
- 117 Overhill Rd
- 188 Clarencedale Ave
- 4141 Windsor Rd
- 4225 Stratford Rd
- 230 Clarencedale Ave
- 4215 Howard St
- 4227 Howard St
- 4209 Howard St
- 4301 Howard St
- 4205 Howard St
- 48 Fairlawn Ave
- 4236 Helena Ave
- 4230 Helena Ave
- 4238 Helena Ave
- 4226 Helena Ave
- 45 Wilma Ave
- 4201 Howard St
- 4311 Howard St
- 4218 Helena Ave
- 4306 Helena Ave
- 4216 Helena Ave
- 4149 Howard St
- 4313 Howard St
- 42 Fairlawn Ave
- 4310 Howard St