Estimated Value: $2,143,000 - $2,454,000
3
Beds
4
Baths
2,559
Sq Ft
$915/Sq Ft
Est. Value
About This Home
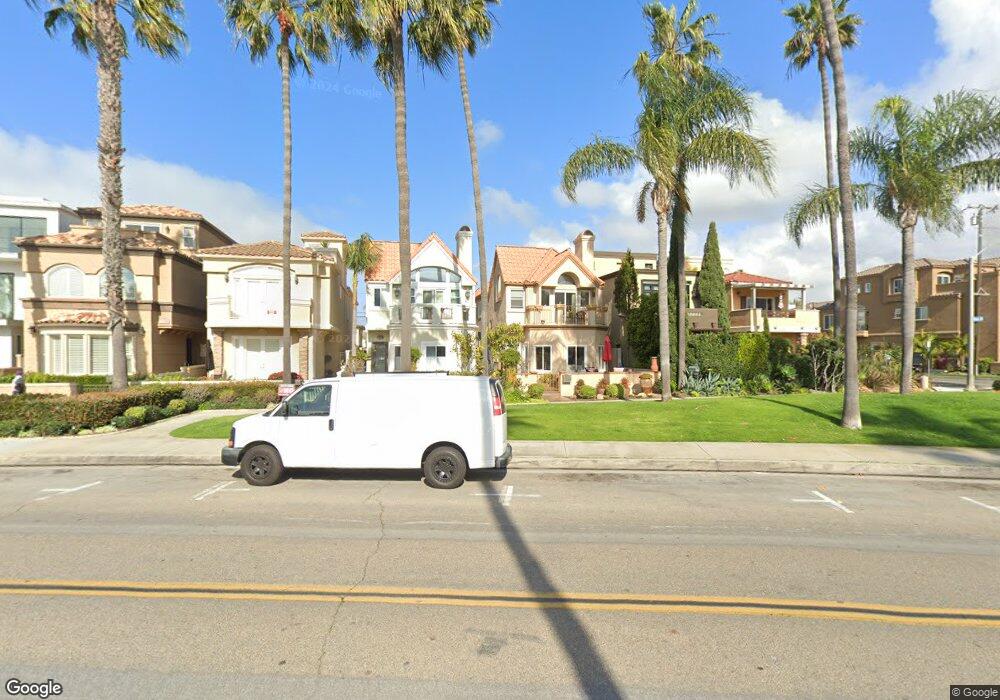
This home is located at 423 6th St, Huntington Beach, CA 92648 and is currently estimated at $2,341,588, approximately $915 per square foot. 423 6th St is a home located in Orange County with nearby schools including Agnes L. Smith Elementary, Ethel Dwyer Middle, and Huntington Beach High School.
Ownership History
Date
Name
Owned For
Owner Type
Purchase Details
Closed on
Feb 9, 2006
Sold by
Duke Janice D
Bought by
Acampora John D and Acampora Gloria Marie
Current Estimated Value
Home Financials for this Owner
Home Financials are based on the most recent Mortgage that was taken out on this home.
Original Mortgage
$417,000
Interest Rate
6.2%
Mortgage Type
Fannie Mae Freddie Mac
Purchase Details
Closed on
Jan 28, 2005
Sold by
Duke Janice D
Bought by
Duke Janice D and Janice Duke & Revocable Trust Of 1992
Home Financials for this Owner
Home Financials are based on the most recent Mortgage that was taken out on this home.
Original Mortgage
$332,500
Interest Rate
5.74%
Mortgage Type
New Conventional
Purchase Details
Closed on
Jan 28, 1994
Sold by
Duke Janice D
Bought by
Duke Janice D and Janice Duke Revocable Trust
Purchase Details
Closed on
Oct 12, 1993
Sold by
Duke Janice D
Bought by
Duke Janice D
Home Financials for this Owner
Home Financials are based on the most recent Mortgage that was taken out on this home.
Original Mortgage
$189,500
Interest Rate
6.81%
Create a Home Valuation Report for This Property
The Home Valuation Report is an in-depth analysis detailing your home's value as well as a comparison with similar homes in the area
Home Values in the Area
Average Home Value in this Area
Purchase History
| Date | Buyer | Sale Price | Title Company |
|---|---|---|---|
| Acampora John D | $1,400,000 | None Available | |
| Duke Janice D | -- | Lawyers Title Company | |
| Duke Janice D | -- | Lawyers Title Company | |
| Duke Janice D | -- | -- | |
| Duke Janice D | -- | Commonwealth Land Title |
Source: Public Records
Mortgage History
| Date | Status | Borrower | Loan Amount |
|---|---|---|---|
| Previous Owner | Acampora John D | $417,000 | |
| Previous Owner | Duke Janice D | $332,500 | |
| Previous Owner | Duke Janice D | $189,500 |
Source: Public Records
Tax History Compared to Growth
Tax History
| Year | Tax Paid | Tax Assessment Tax Assessment Total Assessment is a certain percentage of the fair market value that is determined by local assessors to be the total taxable value of land and additions on the property. | Land | Improvement |
|---|---|---|---|---|
| 2025 | $21,071 | $1,913,075 | $1,541,916 | $371,159 |
| 2024 | $21,071 | $1,875,564 | $1,511,682 | $363,882 |
| 2023 | $16,011 | $1,420,956 | $1,122,483 | $298,473 |
| 2022 | $15,594 | $1,393,095 | $1,100,474 | $292,621 |
| 2021 | $15,303 | $1,365,780 | $1,078,896 | $286,884 |
| 2020 | $15,359 | $1,365,780 | $1,078,896 | $286,884 |
| 2019 | $15,173 | $1,339,000 | $1,057,741 | $281,259 |
| 2018 | $15,230 | $1,339,000 | $1,057,741 | $281,259 |
| 2017 | $13,439 | $1,170,583 | $889,324 | $281,259 |
| 2016 | $13,084 | $1,170,583 | $889,324 | $281,259 |
| 2015 | $12,961 | $1,153,000 | $875,965 | $277,035 |
| 2014 | $11,677 | $1,037,644 | $760,609 | $277,035 |
Source: Public Records
Map
Nearby Homes
- 513 Pecan Ave
- 316 6th St
- 414 Main St Unit 400
- 414 Main St Unit 330
- 414 Main St Unit 430
- 414 Main St Unit 200
- 414 Main St Unit 420
- 621 8th St
- 430 Lake St Unit 304
- 430 Lake St Unit 204
- 309 8th St
- 308 5th St
- 626 Lake St
- 400 Lake St
- 517 Walnut Ave
- 208 Indianapolis Ave
- 620 Huntington St
- 221 10th St
- 214 Walnut Ave
- 605 California St