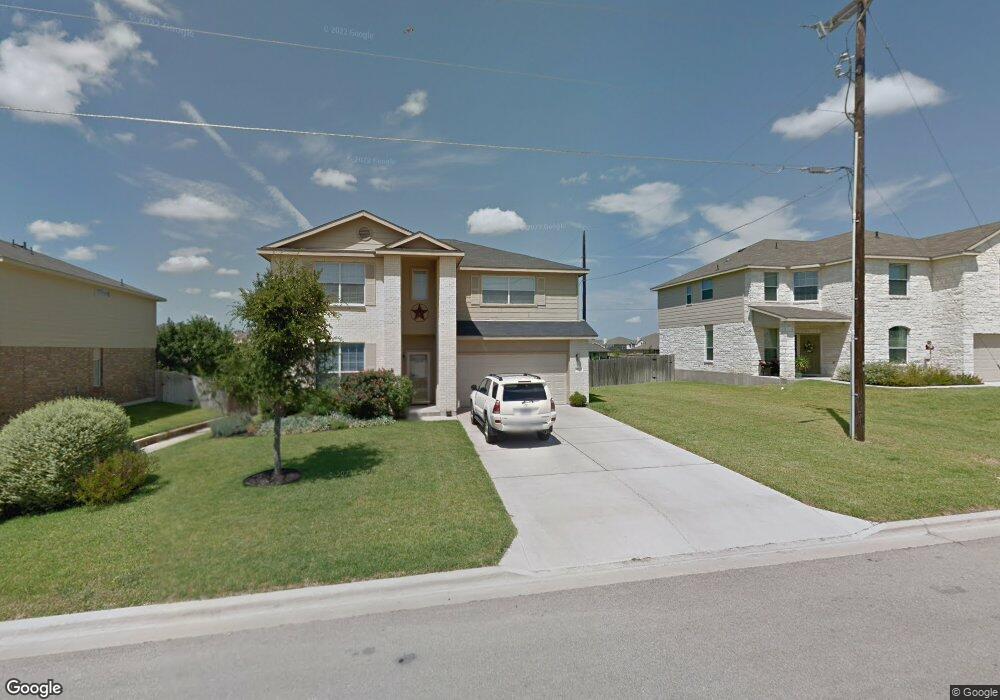
423 Cattail Cir Harker Heights, TX 76548
Estimated Value: $303,776 - $333,000
4
Beds
3
Baths
2,589
Sq Ft
$124/Sq Ft
Est. Value
About This Home
This home is located at 423 Cattail Cir, Harker Heights, TX 76548 and is currently estimated at $322,194, approximately $124 per square foot. 423 Cattail Cir is a home located in Bell County with nearby schools including Skipcha Elementary School, Union Grove Middle School, and Harker Heights High School.
Ownership History
Date
Name
Owned For
Owner Type
Purchase Details
Closed on
Mar 10, 2010
Sold by
Camarato Anthony S and Camarato Julia A
Bought by
Carrico Jason A and Carrico Stacie J
Current Estimated Value
Home Financials for this Owner
Home Financials are based on the most recent Mortgage that was taken out on this home.
Original Mortgage
$196,128
Outstanding Balance
$129,795
Interest Rate
4.95%
Mortgage Type
VA
Estimated Equity
$192,399
Purchase Details
Closed on
Aug 23, 2007
Sold by
Centex Homes
Bought by
Camarato Anthony Sam and Camarato Julia A
Home Financials for this Owner
Home Financials are based on the most recent Mortgage that was taken out on this home.
Original Mortgage
$186,684
Interest Rate
6.72%
Mortgage Type
VA
Purchase Details
Closed on
Aug 25, 2006
Sold by
Stagecoach Valley Ltd
Bought by
Centex Homes
Create a Home Valuation Report for This Property
The Home Valuation Report is an in-depth analysis detailing your home's value as well as a comparison with similar homes in the area
Home Values in the Area
Average Home Value in this Area
Purchase History
| Date | Buyer | Sale Price | Title Company |
|---|---|---|---|
| Carrico Jason A | -- | Monteith Abstract & Title Co | |
| Camarato Anthony Sam | -- | Commerce Title | |
| Centex Homes | -- | Commerce Title Company |
Source: Public Records
Mortgage History
| Date | Status | Borrower | Loan Amount |
|---|---|---|---|
| Open | Carrico Jason A | $196,128 | |
| Previous Owner | Camarato Anthony Sam | $186,684 |
Source: Public Records
Tax History Compared to Growth
Tax History
| Year | Tax Paid | Tax Assessment Tax Assessment Total Assessment is a certain percentage of the fair market value that is determined by local assessors to be the total taxable value of land and additions on the property. | Land | Improvement |
|---|---|---|---|---|
| 2025 | $4,851 | $315,317 | $52,000 | $263,317 |
| 2024 | $4,851 | $312,810 | -- | -- |
| 2023 | $5,040 | $284,373 | $0 | $0 |
| 2022 | $5,260 | $258,521 | $0 | $0 |
| 2021 | $5,445 | $235,019 | $38,000 | $197,019 |
| 2020 | $5,231 | $216,182 | $38,000 | $178,182 |
| 2019 | $5,188 | $205,010 | $19,800 | $185,210 |
| 2018 | $4,784 | $200,849 | $14,400 | $186,449 |
| 2017 | $4,724 | $197,264 | $14,400 | $182,864 |
| 2016 | $4,839 | $202,058 | $14,400 | $187,658 |
| 2014 | $5,258 | $226,463 | $0 | $0 |
Source: Public Records
Map
Nearby Homes
- 419 Cattail Cir
- 424 W Iowa Dr
- 423 W Iowa Dr
- 215 Tribal Trail
- 306 Wrought Iron Dr
- 418 Canoe Dr
- 7603 Zircon Dr
- 505 Lakota Ln
- 6406 Siltstone Loop
- 6309 Serpentine Dr
- 3002 Nickell Back Dr
- 404 Prospector Trail
- 711 Tundra Dr
- 6306 Siltstone Loop
- 5215 Siltstone Loop
- 6209 Alabaster Dr
- 7903 Zircon Dr
- 303 Buckskin Trail
- 501 Qualla Dr
- 6204 Morganite Ln
- 425 Cattail Cir
- 421 Cattail Cir
- 427 Cattail Cir
- 200 Pomo Trail
- 417 Cattail Cir
- 429 Cattail Cir
- 201 Pomo Trail
- 202 Pomo Trail
- 415 Cattail Cir
- 431 W Iowa Dr
- 429 W Iowa Dr
- 203 Tribal Trail
- 433 W Iowa Dr
- 431 Cattail Cir
- 427 W Iowa Dr
- 435 W Iowa Dr
- 204 Pomo Trail
- 203 Pomo Trail
- 205 Tribal Trail
- 413 Cattail Cir