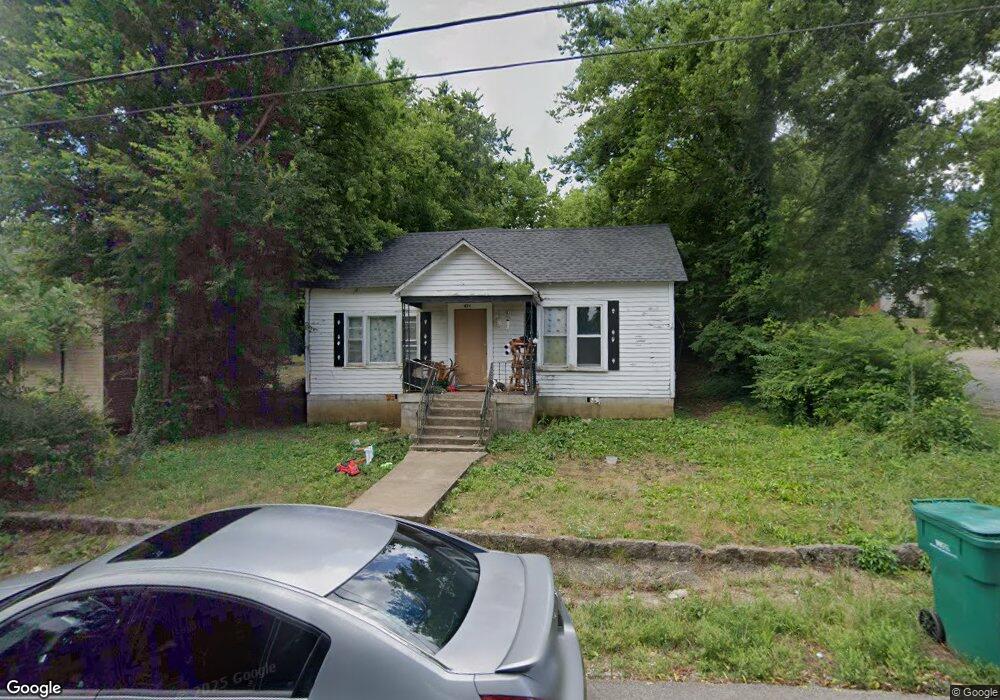
423 Cedar St Lewisburg, TN 37091
Estimated Value: $122,537 - $194,000
--
Bed
1
Bath
1,136
Sq Ft
$137/Sq Ft
Est. Value
About This Home
This home is located at 423 Cedar St, Lewisburg, TN 37091 and is currently estimated at $155,634, approximately $137 per square foot. 423 Cedar St is a home located in Marshall County with nearby schools including Marshall Elementary School, Oak Grove Elementary School, and Westhills Elementary School.
Ownership History
Date
Name
Owned For
Owner Type
Purchase Details
Closed on
Apr 25, 2016
Sold by
Richardson Rex
Bought by
Woodward Chad and Woodward Leslie R
Current Estimated Value
Home Financials for this Owner
Home Financials are based on the most recent Mortgage that was taken out on this home.
Original Mortgage
$18,400
Interest Rate
3.71%
Mortgage Type
Commercial
Purchase Details
Closed on
Mar 8, 2010
Sold by
Richardson Jody Lynn
Bought by
Richardson Rex Allen
Purchase Details
Closed on
Oct 10, 2008
Sold by
Clifton Nathan C
Bought by
Richardson Rex
Purchase Details
Closed on
May 23, 1997
Sold by
Roesel John F
Bought by
Clifton Nathan C
Purchase Details
Closed on
Apr 14, 1989
Bought by
Roesel John F
Purchase Details
Closed on
Mar 15, 1989
Bought by
Calahan Jimmy
Purchase Details
Closed on
Oct 20, 1988
Bought by
Sect Housing & Urban Dev
Create a Home Valuation Report for This Property
The Home Valuation Report is an in-depth analysis detailing your home's value as well as a comparison with similar homes in the area
Home Values in the Area
Average Home Value in this Area
Purchase History
| Date | Buyer | Sale Price | Title Company |
|---|---|---|---|
| Woodward Chad | $21,000 | -- | |
| Richardson Rex Allen | -- | -- | |
| Richardson Rex | $48,000 | -- | |
| Clifton Nathan C | $33,000 | -- | |
| Roesel John F | $21,500 | -- | |
| Calahan Jimmy | $16,600 | -- | |
| Sect Housing & Urban Dev | $43,400 | -- |
Source: Public Records
Mortgage History
| Date | Status | Borrower | Loan Amount |
|---|---|---|---|
| Closed | Woodward Chad | $18,400 |
Source: Public Records
Tax History Compared to Growth
Tax History
| Year | Tax Paid | Tax Assessment Tax Assessment Total Assessment is a certain percentage of the fair market value that is determined by local assessors to be the total taxable value of land and additions on the property. | Land | Improvement |
|---|---|---|---|---|
| 2024 | -- | $18,975 | $2,500 | $16,475 |
| 2023 | $589 | $18,975 | $2,500 | $16,475 |
| 2022 | $589 | $18,975 | $2,500 | $16,475 |
| 2021 | $466 | $10,025 | $1,500 | $8,525 |
| 2020 | $466 | $10,025 | $1,500 | $8,525 |
| 2019 | $452 | $10,025 | $1,500 | $8,525 |
| 2018 | $447 | $10,025 | $1,500 | $8,525 |
| 2017 | $447 | $10,025 | $1,500 | $8,525 |
| 2016 | $404 | $7,875 | $1,375 | $6,500 |
| 2015 | $368 | $7,875 | $1,375 | $6,500 |
| 2014 | $368 | $7,875 | $1,375 | $6,500 |
Source: Public Records
Map
Nearby Homes
- 518 Maple St
- 525 Maple St
- 215 5th Ave N
- 610 Forrest St
- 726 Thomas Ave
- 0 New Lake Rd Unit RTC3030964
- 316 Haynes St
- 416 1st Ave N
- 640 6th Ave S
- 319 E Hill Ave
- 543 2nd Ave N
- 594 5th Ave N
- 632 Colburn Dr
- 630 6th Ave N
- 627 6th Ave N
- 638 2nd Ave N
- 535 Clayton Ave
- 319 Greenwood St
- 231 Greenwood St
- 117 W End Ave N