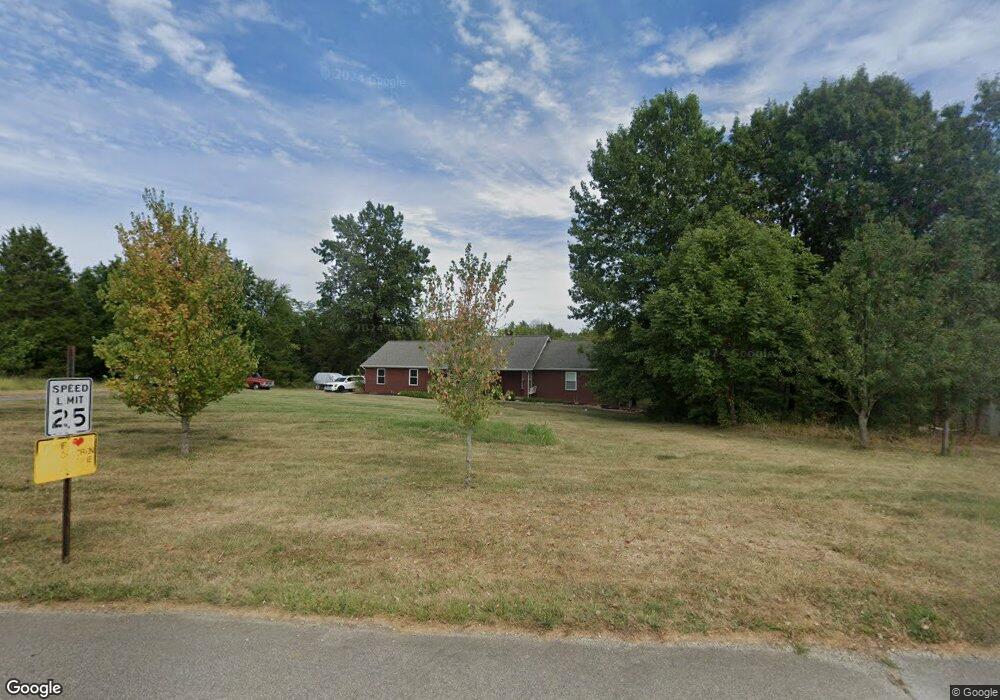
423 Crescent Ridge Dr Taylorsville, KY 40071
Estimated Value: $363,000 - $431,000
3
Beds
2
Baths
1,750
Sq Ft
$227/Sq Ft
Est. Value
About This Home
This home is located at 423 Crescent Ridge Dr, Taylorsville, KY 40071 and is currently estimated at $396,484, approximately $226 per square foot. 423 Crescent Ridge Dr is a home located in Spencer County with nearby schools including Spencer County Middle School and Spencer County High School.
Ownership History
Date
Name
Owned For
Owner Type
Purchase Details
Closed on
Sep 29, 2022
Sold by
Chumbley Brittany and Chumbley Adam
Bought by
Vinson Nicholas and Vinson Ashley
Current Estimated Value
Purchase Details
Closed on
Oct 13, 2020
Sold by
Vinson Nicholas Lee and Vinson Ashley Moore
Bought by
Vinson Nicholas Lee and Vinson Ashley Moore
Home Financials for this Owner
Home Financials are based on the most recent Mortgage that was taken out on this home.
Original Mortgage
$217,000
Interest Rate
2.8%
Mortgage Type
New Conventional
Purchase Details
Closed on
Aug 22, 2018
Sold by
Vinson Nicholas L
Bought by
Vinson Nicholas Lee and Moore Ashley Marie
Purchase Details
Closed on
Jan 10, 2018
Sold by
Vinson Ms Whitney Paige
Bought by
Vinson Mr Nicholas Lee
Create a Home Valuation Report for This Property
The Home Valuation Report is an in-depth analysis detailing your home's value as well as a comparison with similar homes in the area
Home Values in the Area
Average Home Value in this Area
Purchase History
| Date | Buyer | Sale Price | Title Company |
|---|---|---|---|
| Vinson Nicholas | $20,000 | -- | |
| Vinson Nicholas | $20,000 | None Listed On Document | |
| Vinson Nicholas Lee | -- | Solidifi | |
| Vinson Nicholas Lee | -- | None Available | |
| Vinson Mr Nicholas Lee | -- | None Available |
Source: Public Records
Mortgage History
| Date | Status | Borrower | Loan Amount |
|---|---|---|---|
| Previous Owner | Vinson Nicholas Lee | $217,000 |
Source: Public Records
Tax History Compared to Growth
Tax History
| Year | Tax Paid | Tax Assessment Tax Assessment Total Assessment is a certain percentage of the fair market value that is determined by local assessors to be the total taxable value of land and additions on the property. | Land | Improvement |
|---|---|---|---|---|
| 2024 | $2,600 | $265,000 | $45,000 | $220,000 |
| 2023 | $2,621 | $265,000 | $45,000 | $220,000 |
| 2022 | $2,433 | $245,000 | $25,000 | $220,000 |
| 2021 | $2,504 | $245,000 | $25,000 | $220,000 |
| 2020 | $2,533 | $245,000 | $25,000 | $220,000 |
| 2019 | $2,485 | $236,000 | $25,000 | $211,000 |
| 2018 | $2,466 | $236,000 | $25,000 | $211,000 |
| 2017 | $1,960 | $186,000 | $25,000 | $161,000 |
| 2016 | $1,933 | $186,000 | $25,000 | $161,000 |
| 2015 | $1,672 | $186,000 | $0 | $0 |
| 2014 | $1,672 | $186,000 | $0 | $0 |
Source: Public Records
Map
Nearby Homes
- 4815 Plum Creek Rd
- 230 Kristen Dr
- 3574 Plum Creek Rd
- 47 Eisenhower Ct
- 51 Elk Chase Dr
- 327 Wilsonville Heights Dr
- 56 Bush Ct
- 2075 Plum Creek Rd
- 50 Masters Ln
- 199 Allen Place E
- 365 Ridgecrest Dr
- 16715 Dry Ridge Rd
- 58 Tsueda Dr
- 75 Pin Oak Dr
- 137 Stone Ridge Ct
- 216 Locust Dr
- 1173 Johnson Ln
- 16311 Dry Ridge Rd
- 442 Wilsonville Rd
- 3542 Hochstrasser Rd
- 489 Crescent Ridge Dr
- 0 Crescent Ridge Dr Unit LOT 55 816200
- 58 Crescent Ridge Dr
- 0 Crescent Ridge Dr
- 90 Crescent Ridge Dr
- 90 Crescent Ridge Dr
- Lot 95 Crescent Ridge Dr
- Lot 76 Crescent Ridge Dr
- 20 Hill Ridge Rd
- Lot 74 Peterson Farms
- 70 Hill Ridge Rd
- 430 Crescent Ridge Dr
- 390 Crescent Ridge Dr
- 200 Hill Ridge Rd
- 545 Crescent Ridge Dr
- 0 Hill Ridge Dr Unit 1274274
- 0 Hill Ridge Dr Unit LOT E1,E 1332338
- 0 Hill Ridge Dr Unit LOT 87 108578
- 360 Crescent Ridge Dr
- 321 Crescent Ridge Dr