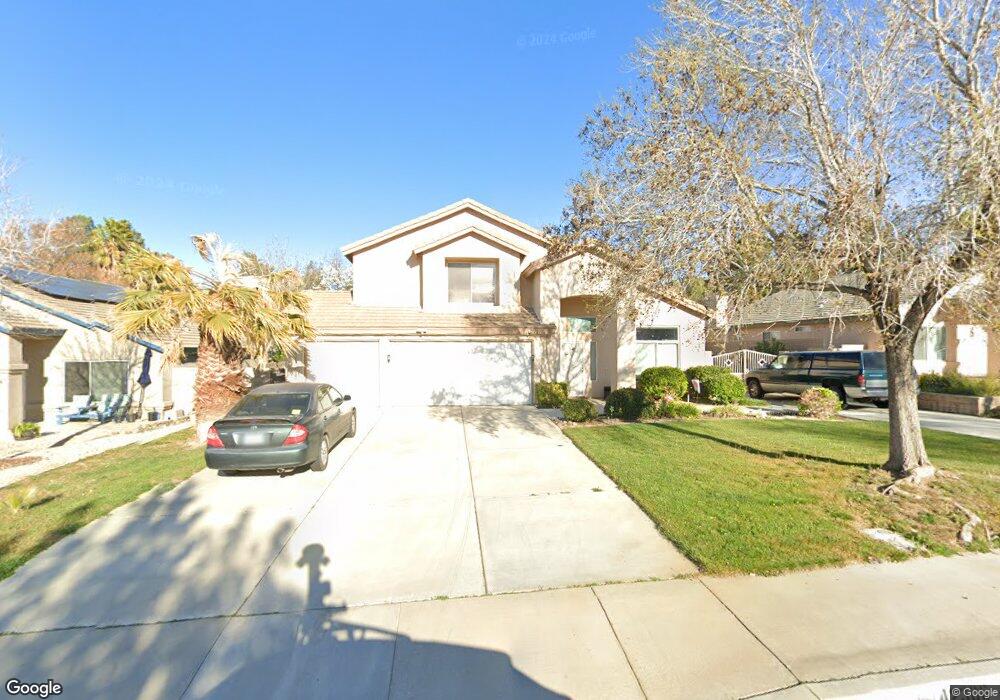
42306 Blueflax Ave Lancaster, CA 93536
West Lancaster NeighborhoodEstimated Value: $610,366 - $724,000
4
Beds
3
Baths
2,686
Sq Ft
$240/Sq Ft
Est. Value
About This Home
This home is located at 42306 Blueflax Ave, Lancaster, CA 93536 and is currently estimated at $645,592, approximately $240 per square foot. 42306 Blueflax Ave is a home located in Los Angeles County with nearby schools including Sundown Elementary School, Joe Walker Middle School, and Quartz Hill High School.
Ownership History
Date
Name
Owned For
Owner Type
Purchase Details
Closed on
Apr 1, 2016
Sold by
Miracle Robert J
Bought by
The Robert & Coleen Miracle Trust
Current Estimated Value
Purchase Details
Closed on
Jul 24, 2001
Sold by
Nowicky David J
Bought by
Miracle Robert J and Miracle Coleen M
Home Financials for this Owner
Home Financials are based on the most recent Mortgage that was taken out on this home.
Original Mortgage
$124,000
Outstanding Balance
$47,613
Interest Rate
7.09%
Estimated Equity
$597,979
Purchase Details
Closed on
Aug 8, 2000
Sold by
Nowicky David J
Bought by
Nowicky Md David J and Nowicky Sheri L
Purchase Details
Closed on
Jun 6, 1997
Sold by
Beazer Homes Holdings Corp
Bought by
Nowicky Md David J and Nowicky Sheri L
Home Financials for this Owner
Home Financials are based on the most recent Mortgage that was taken out on this home.
Original Mortgage
$158,418
Interest Rate
7.94%
Mortgage Type
FHA
Create a Home Valuation Report for This Property
The Home Valuation Report is an in-depth analysis detailing your home's value as well as a comparison with similar homes in the area
Home Values in the Area
Average Home Value in this Area
Purchase History
| Date | Buyer | Sale Price | Title Company |
|---|---|---|---|
| The Robert & Coleen Miracle Trust | -- | None Available | |
| Miracle Robert J | $200,000 | Lawyers Title | |
| Nowicky Md David J | -- | -- | |
| Nowicky Md David J | $162,500 | Investors Title Company |
Source: Public Records
Mortgage History
| Date | Status | Borrower | Loan Amount |
|---|---|---|---|
| Open | Miracle Robert J | $124,000 | |
| Previous Owner | Nowicky Md David J | $158,418 |
Source: Public Records
Tax History Compared to Growth
Tax History
| Year | Tax Paid | Tax Assessment Tax Assessment Total Assessment is a certain percentage of the fair market value that is determined by local assessors to be the total taxable value of land and additions on the property. | Land | Improvement |
|---|---|---|---|---|
| 2025 | $4,968 | $295,433 | $59,078 | $236,355 |
| 2024 | $4,968 | $289,641 | $57,920 | $231,721 |
| 2023 | $4,914 | $283,963 | $56,785 | $227,178 |
| 2022 | $4,701 | $278,396 | $55,672 | $222,724 |
| 2021 | $4,282 | $272,938 | $54,581 | $218,357 |
| 2019 | $4,177 | $264,845 | $52,963 | $211,882 |
| 2018 | $4,119 | $259,653 | $51,925 | $207,728 |
| 2016 | $3,895 | $249,571 | $49,909 | $199,662 |
| 2015 | $3,851 | $245,823 | $49,160 | $196,663 |
| 2014 | $3,831 | $241,009 | $48,198 | $192,811 |
Source: Public Records
Map
Nearby Homes
- 8150 Avenue L- 10
- 42257 Sand Palm Way
- 6608 Teasdale St
- 6558 Highbluff Way
- 6533 W Avenue L-10
- 42058 Blueflax Ave
- 42344 Camden Way
- 42428 Camden Way
- 42350 Encanto Way
- 6727 Miramar Ln
- 42532 Marsuerite Way
- 0 65th St W
- 0 Avenue l6 Unit 21000051
- 42016 Silver Puffs Dr
- 42016 Silverpuffs Dr
- 42547 Camden Way
- 42164 Valley Vista Dr
- 7005 Hartford Ln
- 41858 Montana Dr
- 41843 Montana Dr
- 42314 Blueflax Ave
- 42260 Blueflax Ave
- 42252 Blueflax Ave
- 42322 Blueflax Ave
- 3540 L-10
- 3542 L-10
- 42313 Seville Cir
- 42301 Blueflax Ave
- 42309 Blueflax Ave
- 10 St. W and Ave E Sierra Hwy
- 85 St. W and Avenue F-12
- 86 St. W and Avenue F-9
- 86 St. W and Avenue F-10
- 88 St. W and Avenue F-8
- 4 St. E and Avenue F-14
- 85 St. W and Ave A
- 86 St. W and Ave A
- 42244 Blueflax Ave
- 42244 Blueflax Ave Quartz Hill
- 42317 Blueflax Ave