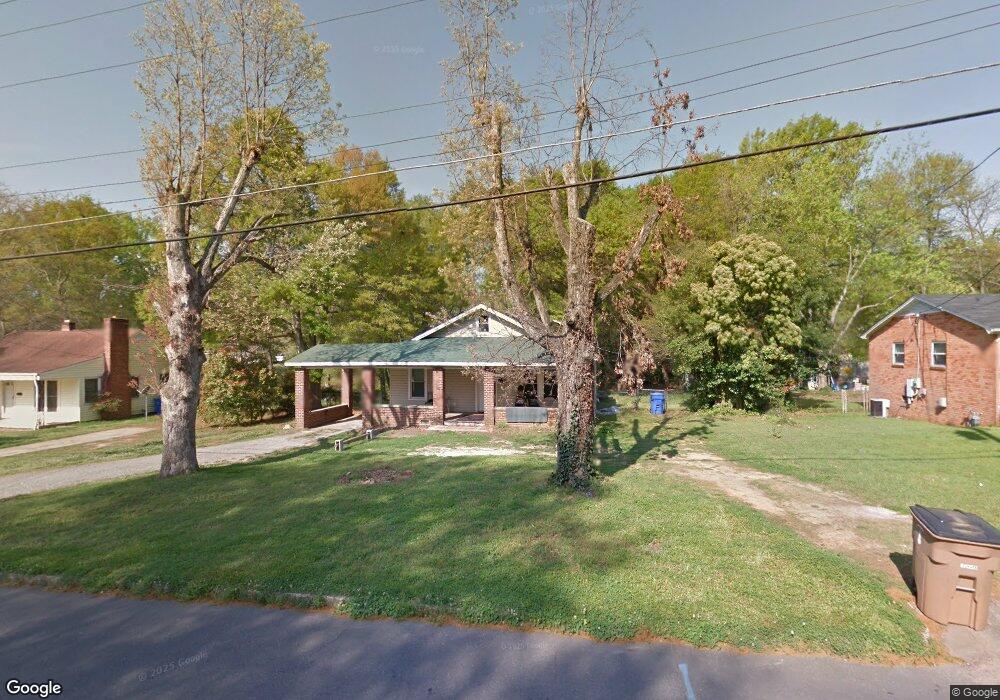
424 Gold St Unit 8 Shelby, NC 28150
Estimated Value: $181,000 - $225,000
4
Beds
2
Baths
1,484
Sq Ft
$139/Sq Ft
Est. Value
About This Home
This home is located at 424 Gold St Unit 8, Shelby, NC 28150 and is currently estimated at $205,882, approximately $138 per square foot. 424 Gold St Unit 8 is a home located in Cleveland County with nearby schools including Graham Elementary School, Shelby Middle School, and Shelby High School.
Ownership History
Date
Name
Owned For
Owner Type
Purchase Details
Closed on
Jul 26, 2022
Sold by
Jordan Karen H
Bought by
Lisbey Kevin L and Lisbey Yolanda
Current Estimated Value
Home Financials for this Owner
Home Financials are based on the most recent Mortgage that was taken out on this home.
Original Mortgage
$132,275
Outstanding Balance
$126,175
Interest Rate
5.23%
Mortgage Type
FHA
Estimated Equity
$79,707
Purchase Details
Closed on
Oct 25, 2007
Sold by
Jordan Jeffrey B and Jordan Karen H
Bought by
Jordan Karen H
Create a Home Valuation Report for This Property
The Home Valuation Report is an in-depth analysis detailing your home's value as well as a comparison with similar homes in the area
Home Values in the Area
Average Home Value in this Area
Purchase History
| Date | Buyer | Sale Price | Title Company |
|---|---|---|---|
| Lisbey Kevin L | $182,000 | Hands Law Office Pllc | |
| Jordan Karen H | -- | None Available |
Source: Public Records
Mortgage History
| Date | Status | Borrower | Loan Amount |
|---|---|---|---|
| Open | Lisbey Kevin L | $132,275 |
Source: Public Records
Tax History Compared to Growth
Tax History
| Year | Tax Paid | Tax Assessment Tax Assessment Total Assessment is a certain percentage of the fair market value that is determined by local assessors to be the total taxable value of land and additions on the property. | Land | Improvement |
|---|---|---|---|---|
| 2025 | $1,582 | $158,977 | $15,540 | $143,437 |
| 2024 | $805 | $64,695 | $12,765 | $51,930 |
| 2023 | $801 | $64,695 | $12,765 | $51,930 |
| 2022 | $801 | $64,695 | $12,765 | $51,930 |
| 2021 | $805 | $64,695 | $12,765 | $51,930 |
| 2020 | $676 | $52,671 | $12,765 | $39,906 |
| 2019 | $676 | $52,671 | $12,765 | $39,906 |
| 2018 | $675 | $52,671 | $12,765 | $39,906 |
| 2017 | $659 | $52,671 | $12,765 | $39,906 |
| 2016 | $660 | $52,671 | $12,765 | $39,906 |
| 2015 | $859 | $72,771 | $12,765 | $60,006 |
| 2014 | $859 | $72,771 | $12,765 | $60,006 |
Source: Public Records
Map
Nearby Homes