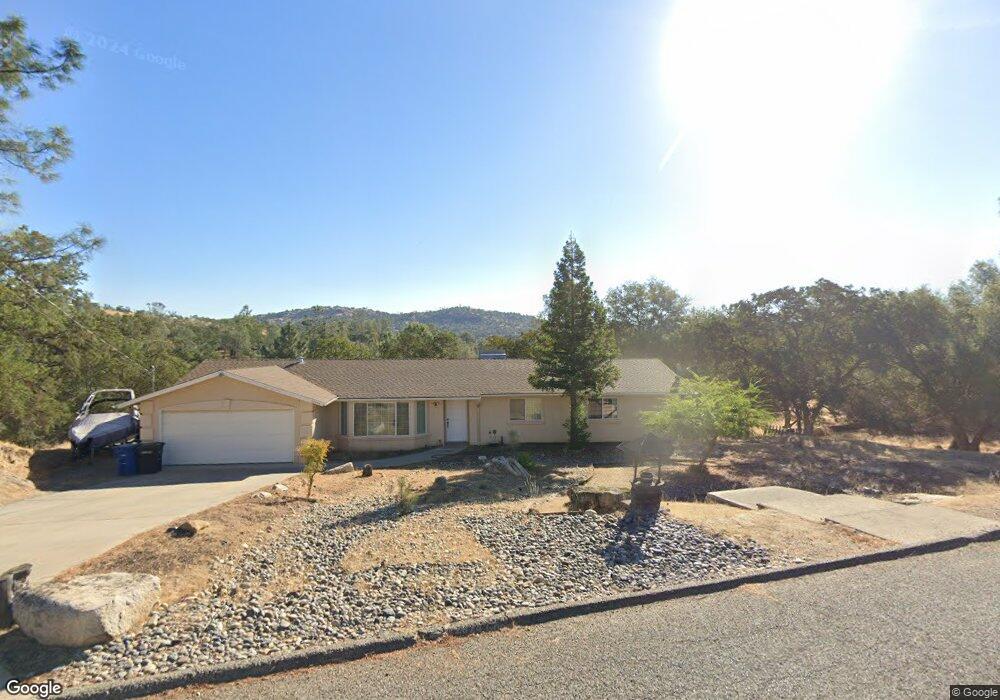
42426 Long Hollow Dr Coarsegold, CA 93614
Estimated Value: $332,000 - $373,000
3
Beds
2
Baths
1,571
Sq Ft
$228/Sq Ft
Est. Value
About This Home
This home is located at 42426 Long Hollow Dr, Coarsegold, CA 93614 and is currently estimated at $357,707, approximately $227 per square foot. 42426 Long Hollow Dr is a home located in Madera County with nearby schools including Yosemite Lakes Christian Academy.
Ownership History
Date
Name
Owned For
Owner Type
Purchase Details
Closed on
Mar 23, 2012
Sold by
Chen Joseph C
Bought by
Chen Joseph C and Chen Carla M Florian
Current Estimated Value
Purchase Details
Closed on
Nov 4, 2009
Sold by
Chen Joseph C
Bought by
Chen Joseph C
Purchase Details
Closed on
Oct 14, 2005
Sold by
Chen Joseph
Bought by
Chen Joseph C
Purchase Details
Closed on
Oct 1, 2003
Sold by
Eidal Helen L
Bought by
Chen Joseph
Home Financials for this Owner
Home Financials are based on the most recent Mortgage that was taken out on this home.
Original Mortgage
$152,800
Outstanding Balance
$68,900
Interest Rate
5.72%
Mortgage Type
Unknown
Estimated Equity
$288,807
Purchase Details
Closed on
Jul 25, 2003
Sold by
Eidal Helen L and Setran Howard N
Bought by
Eidal Helen L
Create a Home Valuation Report for This Property
The Home Valuation Report is an in-depth analysis detailing your home's value as well as a comparison with similar homes in the area
Home Values in the Area
Average Home Value in this Area
Purchase History
| Date | Buyer | Sale Price | Title Company |
|---|---|---|---|
| Chen Joseph C | -- | None Available | |
| Chen Joseph C | -- | None Available | |
| Chen Joseph C | -- | Fidelity National Title Co | |
| Chen Joseph C | -- | Fidelity National Title Co | |
| Chen Joseph C | -- | Fidelity National Title Co | |
| Chen Joseph C | -- | Public | |
| Chen Joseph | $191,000 | Chicago Title | |
| Eidal Helen L | -- | Chicago Title |
Source: Public Records
Mortgage History
| Date | Status | Borrower | Loan Amount |
|---|---|---|---|
| Open | Chen Joseph | $152,800 |
Source: Public Records
Tax History Compared to Growth
Tax History
| Year | Tax Paid | Tax Assessment Tax Assessment Total Assessment is a certain percentage of the fair market value that is determined by local assessors to be the total taxable value of land and additions on the property. | Land | Improvement |
|---|---|---|---|---|
| 2025 | $2,716 | $271,538 | $63,968 | $207,570 |
| 2023 | $2,716 | $260,995 | $61,485 | $199,510 |
| 2022 | $2,655 | $255,879 | $60,280 | $195,599 |
| 2021 | $2,600 | $250,863 | $59,099 | $191,764 |
| 2020 | $2,391 | $229,250 | $39,657 | $189,593 |
| 2019 | $2,280 | $218,334 | $37,769 | $180,565 |
| 2018 | $2,208 | $211,975 | $36,669 | $175,306 |
| 2017 | $1,981 | $189,263 | $32,740 | $156,523 |
| 2016 | $1,912 | $185,552 | $32,098 | $153,454 |
| 2015 | $1,821 | $176,716 | $24,855 | $151,861 |
| 2014 | $1,679 | $162,125 | $22,803 | $139,322 |
Source: Public Records
Map
Nearby Homes
- 42571 Long Hollow Dr
- 42607 Long Hollow Dr
- 0 Lot 856 Deep Forest Dr
- 41391 Long Hollow Ln
- 0 Deep Forest Dr Unit 625073
- 0 Deep Forest Dr Unit 634484
- 0 Deep Forest Dr Unit FR25169251
- 0 Deep Forest Dr Unit 632557
- 0 Horseshoe Dr Unit FR23145006
- 1703 Long Hollow Dr
- 741 Long Hollow Dr
- 741 lot Long Hollow Dr
- 0 6.48 AC Long Hollow Dr
- 41924 Patrick Ave
- 0 Lot 880 Jim Bowie Ct
- 1 Jim Bowie Ct
- 29638 Jim Bowie Ct
- 0 Jim Bowie Ct
- 0 Crystal Springs Way Unit 41095131
- 608 Deep Forest Ct
- 42470 Long Hollow Dr
- 42422 Deep Forest Dr
- 42512 Long Hollow Dr
- 42471 Deep Forest Dr
- 42330 Long Hollow Dr
- 42450 Deep Forest Dr
- 42423 Long Hollow Dr
- 42471 Long Hollow Dr
- 42497 Deep Forest Dr
- 42534 Long Hollow Dr
- 42484 Deep Forest Dr
- 42489 Deep Forest Dr
- 42300 Long Hollow Dr
- 42445 Long Hollow Dr
- 42349 Long Hollow Dr
- 42507 Deep Forest Dr
- 42315 Long Hollow Dr
- 0 1 55 Acre Deep Forest Dr
- 42552 Long Hollow Dr
- 42274 Long Hollow Dr