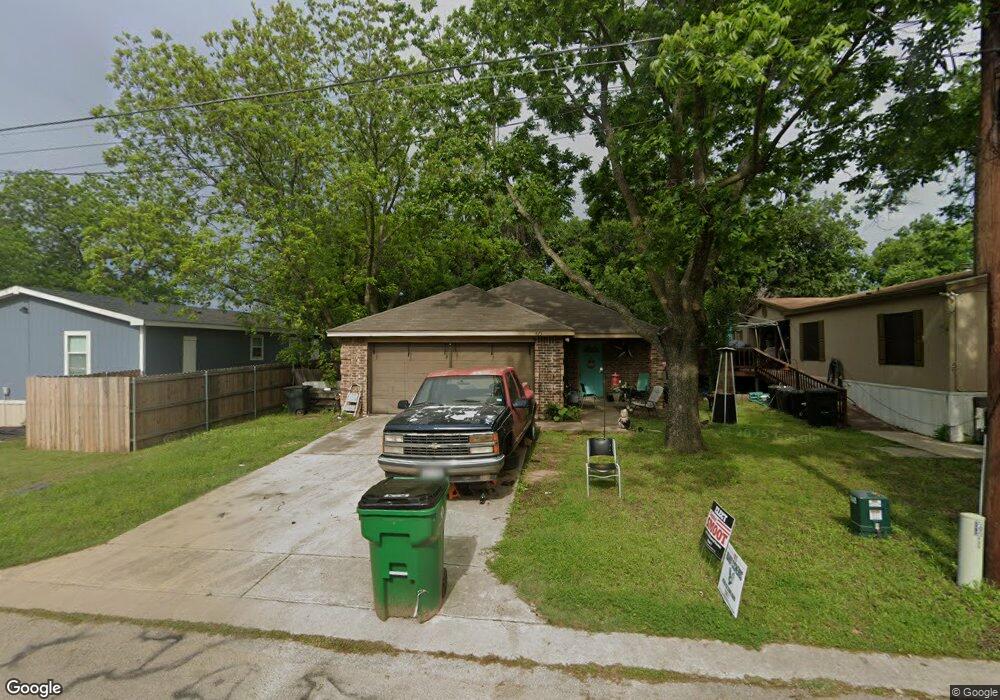
425 Grayson Ct Joshua, TX 76058
Estimated Value: $267,000 - $286,000
3
Beds
2
Baths
1,540
Sq Ft
$180/Sq Ft
Est. Value
About This Home
This home is located at 425 Grayson Ct, Joshua, TX 76058 and is currently estimated at $277,184, approximately $179 per square foot. 425 Grayson Ct is a home located in Johnson County with nearby schools including H.D. Staples Elementary School, R C Loflin Middle School, and Joshua High School.
Ownership History
Date
Name
Owned For
Owner Type
Purchase Details
Closed on
Jul 22, 2016
Sold by
Matthern Julia
Bought by
Shores Chelcea Danielle and Shores Kennetb Williams
Current Estimated Value
Home Financials for this Owner
Home Financials are based on the most recent Mortgage that was taken out on this home.
Original Mortgage
$116,400
Outstanding Balance
$92,802
Interest Rate
3.54%
Mortgage Type
New Conventional
Estimated Equity
$184,382
Purchase Details
Closed on
Jul 13, 2007
Sold by
Jeffcoat Clint
Bought by
Mattern Julia
Home Financials for this Owner
Home Financials are based on the most recent Mortgage that was taken out on this home.
Original Mortgage
$101,250
Interest Rate
7.87%
Mortgage Type
Adjustable Rate Mortgage/ARM
Create a Home Valuation Report for This Property
The Home Valuation Report is an in-depth analysis detailing your home's value as well as a comparison with similar homes in the area
Home Values in the Area
Average Home Value in this Area
Purchase History
| Date | Buyer | Sale Price | Title Company |
|---|---|---|---|
| Shores Chelcea Danielle | -- | Capital Title | |
| Mattern Julia | -- | Partners Title Company |
Source: Public Records
Mortgage History
| Date | Status | Borrower | Loan Amount |
|---|---|---|---|
| Open | Shores Chelcea Danielle | $116,400 | |
| Previous Owner | Mattern Julia | $20,250 | |
| Previous Owner | Mattern Julia | $101,250 |
Source: Public Records
Tax History Compared to Growth
Tax History
| Year | Tax Paid | Tax Assessment Tax Assessment Total Assessment is a certain percentage of the fair market value that is determined by local assessors to be the total taxable value of land and additions on the property. | Land | Improvement |
|---|---|---|---|---|
| 2025 | $3,991 | $276,763 | $40,000 | $236,763 |
| 2024 | $5,452 | $224,012 | $0 | $0 |
| 2023 | $3,283 | $262,325 | $40,000 | $222,325 |
| 2022 | $4,645 | $242,113 | $40,000 | $202,113 |
| 2021 | $4,260 | $168,304 | $15,000 | $153,304 |
| 2020 | $4,320 | $160,018 | $15,000 | $145,018 |
| 2019 | $4,127 | $143,444 | $15,000 | $128,444 |
| 2018 | $4,119 | $139,301 | $15,000 | $124,301 |
| 2017 | $3,504 | $118,585 | $15,000 | $103,585 |
| 2016 | $3,382 | $114,441 | $15,000 | $99,441 |
| 2015 | $2,195 | $97,867 | $15,000 | $82,867 |
| 2014 | $2,195 | $81,293 | $15,000 | $66,293 |
Source: Public Records
Map
Nearby Homes