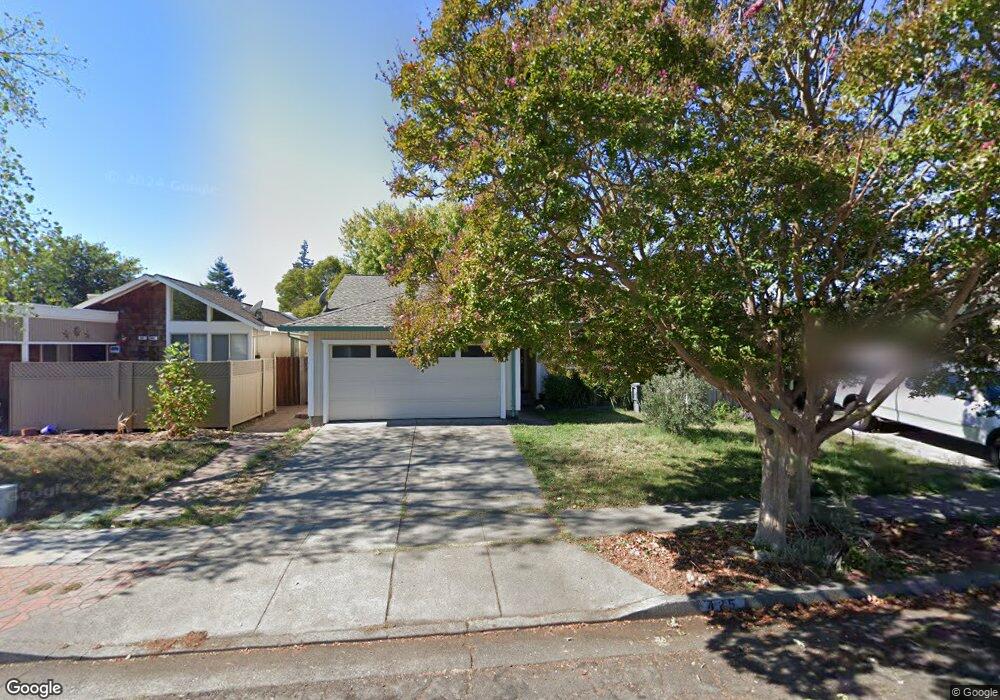
425 Korbel Place Santa Rosa, CA 95409
Estimated Value: $563,000 - $629,000
3
Beds
2
Baths
1,110
Sq Ft
$539/Sq Ft
Est. Value
About This Home
This home is located at 425 Korbel Place, Santa Rosa, CA 95409 and is currently estimated at $598,385, approximately $539 per square foot. 425 Korbel Place is a home located in Sonoma County with nearby schools including Rincon Valley Middle School, Maria Carrillo High School, and Binkley Elementary Charter School.
Ownership History
Date
Name
Owned For
Owner Type
Purchase Details
Closed on
Jul 31, 2014
Sold by
Clark Robert Thomas and Clark Sherrill Joan
Bought by
Clark Family Trust
Current Estimated Value
Purchase Details
Closed on
May 13, 2013
Sold by
Mccabe Martha and Barone Theodore A
Bought by
Clark Robert and Clark Sherrill
Home Financials for this Owner
Home Financials are based on the most recent Mortgage that was taken out on this home.
Original Mortgage
$248,250
Outstanding Balance
$175,119
Interest Rate
3.38%
Mortgage Type
New Conventional
Estimated Equity
$423,266
Purchase Details
Closed on
Sep 16, 2002
Sold by
Mccabe Martha and Rothlin Hannah
Bought by
Mccabe Martha and Rothlin Hannah
Create a Home Valuation Report for This Property
The Home Valuation Report is an in-depth analysis detailing your home's value as well as a comparison with similar homes in the area
Home Values in the Area
Average Home Value in this Area
Purchase History
| Date | Buyer | Sale Price | Title Company |
|---|---|---|---|
| Clark Family Trust | -- | None Available | |
| Clark Robert Thomas | -- | None Available | |
| Clark Robert | $331,000 | First American Title Company | |
| Mccabe Martha | -- | First American Title Company | |
| Mccabe Martha | -- | -- |
Source: Public Records
Mortgage History
| Date | Status | Borrower | Loan Amount |
|---|---|---|---|
| Open | Clark Robert | $248,250 |
Source: Public Records
Tax History Compared to Growth
Tax History
| Year | Tax Paid | Tax Assessment Tax Assessment Total Assessment is a certain percentage of the fair market value that is determined by local assessors to be the total taxable value of land and additions on the property. | Land | Improvement |
|---|---|---|---|---|
| 2025 | $4,787 | $407,590 | $160,079 | $247,511 |
| 2024 | $4,787 | $399,599 | $156,941 | $242,658 |
| 2023 | $4,787 | $391,764 | $153,864 | $237,900 |
| 2022 | $4,423 | $384,084 | $150,848 | $233,236 |
| 2021 | $4,335 | $376,554 | $147,891 | $228,663 |
| 2020 | $4,320 | $372,694 | $146,375 | $226,319 |
| 2019 | $4,280 | $365,387 | $143,505 | $221,882 |
| 2018 | $4,255 | $358,224 | $140,692 | $217,532 |
| 2017 | $4,178 | $351,201 | $137,934 | $213,267 |
| 2016 | $4,131 | $344,316 | $135,230 | $209,086 |
| 2015 | $4,008 | $339,145 | $133,199 | $205,946 |
| 2014 | $3,863 | $332,502 | $130,590 | $201,912 |
Source: Public Records
Map
Nearby Homes
- 311 Algiers Ct
- 537 Emerald Park Ct
- 5015 Charmian Dr
- 61 Coronado Cir
- 305 Simone Place N
- 66 Coronado Cir
- 164 Brookview Ct
- 103 Glenoak Ct
- 29 Coronado Cir
- 71 Oakcreek Ct
- 5209 San Luis Ave
- 52 Oakstone Ct Unit 52
- 48 Shadyleaf Ct
- 5086 Charmian Dr
- 31 Springhill Ct
- 5020 Roma St
- 28 Springhill Ct
- 5198 Parkhurst Dr
- 5056 Fravel Ln
- 10 Sandstone Ct
- 421 Korbel Place
- 429 Korbel Place
- 417 Korbel Place
- 433 Korbel Place
- 413 Korbel Place
- 437 Korbel Place
- 420 Korbel Place
- 422 Saint Mary Place
- 426 Saint Mary Place
- 424 Korbel Place
- 416 Korbel Place
- 418 Saint Mary Place
- 430 Saint Mary Place
- 412 Korbel Place
- 428 Korbel Place
- 412 Saint Mary Place
- 409 Korbel Place
- 434 Saint Mary Place
- 408 Korbel Place
- 432 Korbel Place