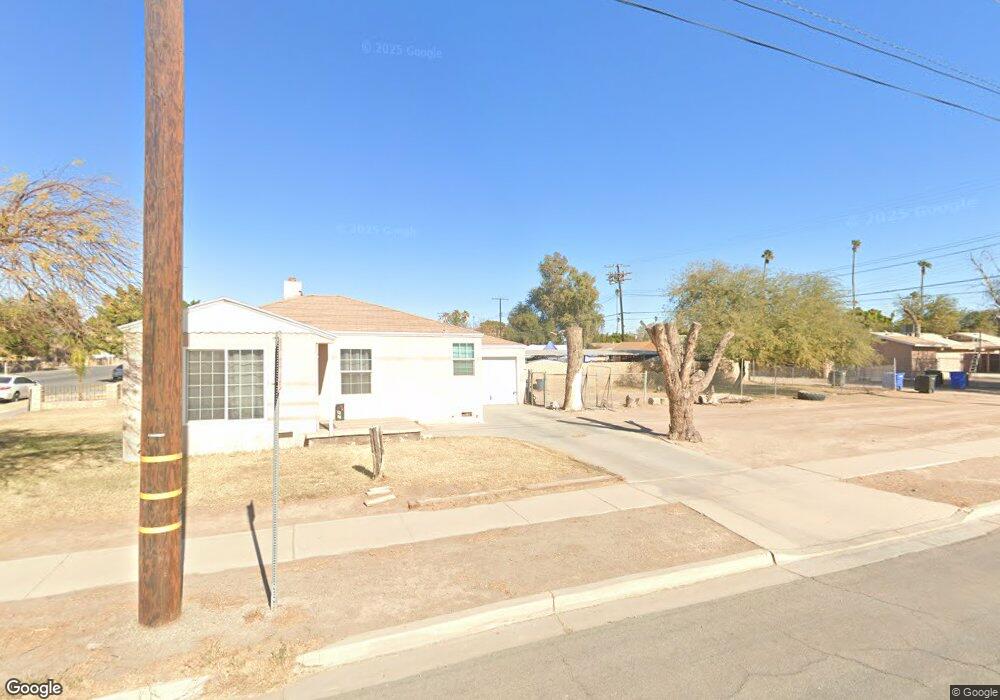
425 W 6th St Holtville, CA 92250
Estimated Value: $194,715 - $338,000
--
Bed
--
Bath
888
Sq Ft
$317/Sq Ft
Est. Value
About This Home
This home is located at 425 W 6th St, Holtville, CA 92250 and is currently estimated at $281,429, approximately $316 per square foot. 425 W 6th St is a home located in Imperial County with nearby schools including Holtville High School.
Ownership History
Date
Name
Owned For
Owner Type
Purchase Details
Closed on
Jan 18, 2007
Sold by
Chaney Cheryl Cathleen
Bought by
Chaney Cheryl C and Cheryl C Chaney 2007 Trust
Current Estimated Value
Purchase Details
Closed on
Sep 7, 2004
Sold by
Chaney Cheryl Cathleen
Bought by
Chaney Cheryl Cathleen
Purchase Details
Closed on
Nov 17, 2003
Sold by
Brady Nina R
Bought by
Brady Richard E
Purchase Details
Closed on
Feb 20, 2003
Sold by
Brady Richard Emmit and Brady Richard E
Bought by
Brady Richard E
Purchase Details
Closed on
Jan 13, 2003
Sold by
Brady Richard E
Bought by
Brady Richard E
Create a Home Valuation Report for This Property
The Home Valuation Report is an in-depth analysis detailing your home's value as well as a comparison with similar homes in the area
Home Values in the Area
Average Home Value in this Area
Purchase History
| Date | Buyer | Sale Price | Title Company |
|---|---|---|---|
| Chaney Cheryl C | -- | None Available | |
| Chaney Cheryl Cathleen | -- | -- | |
| Chaney Cheryl Cathleen | -- | -- | |
| Brady Richard E | -- | -- | |
| Brady Richard E | -- | -- | |
| Brady Richard E | -- | -- |
Source: Public Records
Tax History Compared to Growth
Tax History
| Year | Tax Paid | Tax Assessment Tax Assessment Total Assessment is a certain percentage of the fair market value that is determined by local assessors to be the total taxable value of land and additions on the property. | Land | Improvement |
|---|---|---|---|---|
| 2025 | $464 | $43,175 | $8,145 | $35,030 |
| 2023 | $464 | $41,501 | $7,830 | $33,671 |
| 2022 | $462 | $40,688 | $7,677 | $33,011 |
| 2021 | $456 | $39,891 | $7,527 | $32,364 |
| 2020 | $438 | $39,483 | $7,450 | $32,033 |
| 2019 | $431 | $38,709 | $7,304 | $31,405 |
| 2018 | $425 | $37,951 | $7,161 | $30,790 |
| 2017 | $413 | $37,208 | $7,021 | $30,187 |
| 2016 | $401 | $36,480 | $6,884 | $29,596 |
| 2015 | $396 | $35,933 | $6,781 | $29,152 |
| 2014 | $386 | $35,230 | $6,649 | $28,581 |
Source: Public Records
Map
Nearby Homes