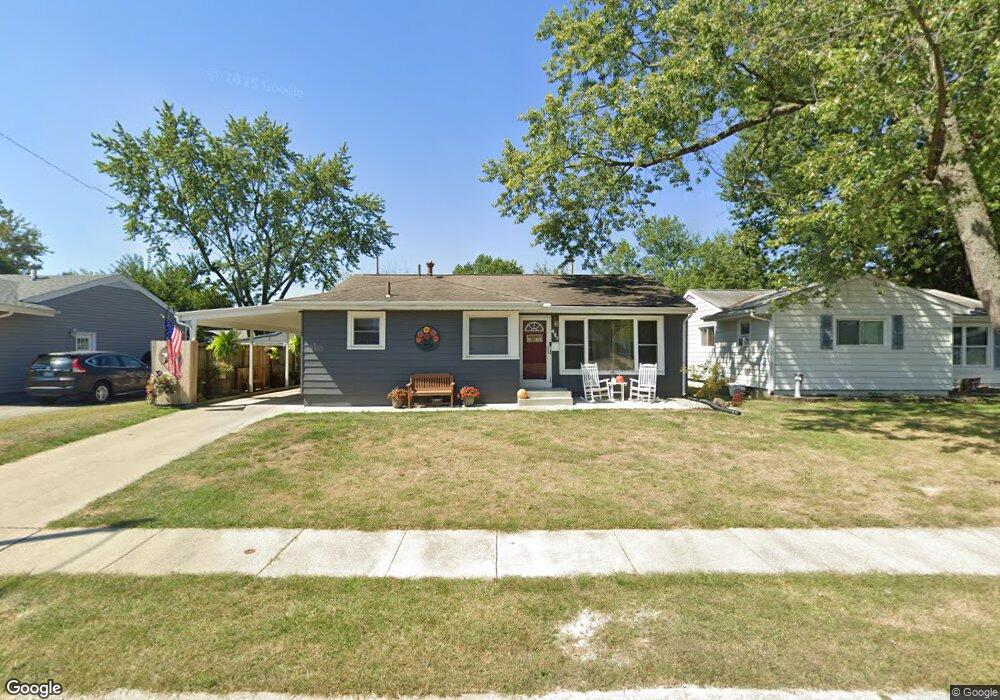
427 Beaver Ave Columbus, OH 43213
Estimated Value: $193,000 - $228,000
3
Beds
2
Baths
1,148
Sq Ft
$189/Sq Ft
Est. Value
About This Home
This home is located at 427 Beaver Ave, Columbus, OH 43213 and is currently estimated at $216,417, approximately $188 per square foot. 427 Beaver Ave is a home located in Franklin County with nearby schools including Etna Road Elementary School, Beechwood Elementary School, and Rosemore Middle School.
Ownership History
Date
Name
Owned For
Owner Type
Purchase Details
Closed on
Dec 14, 2007
Sold by
Allhome Restorations Llc
Bought by
Waybright Mickie S
Current Estimated Value
Home Financials for this Owner
Home Financials are based on the most recent Mortgage that was taken out on this home.
Original Mortgage
$3,754
Interest Rate
6.31%
Mortgage Type
Stand Alone Second
Purchase Details
Closed on
Jul 24, 2007
Sold by
Wells Fargo Bank Na
Bought by
Allhome Restoration Llc
Purchase Details
Closed on
Jul 6, 2007
Sold by
Stults Christi R and Case #04Cve09 9500
Bought by
Wells Fargo Bank Na and Asset Backed Securities Corp Home Equity
Purchase Details
Closed on
Oct 26, 2001
Sold by
Marcum Joann C and Marcum Joann
Bought by
Stults Christi R and Stults Stephen M
Create a Home Valuation Report for This Property
The Home Valuation Report is an in-depth analysis detailing your home's value as well as a comparison with similar homes in the area
Home Values in the Area
Average Home Value in this Area
Purchase History
| Date | Buyer | Sale Price | Title Company |
|---|---|---|---|
| Waybright Mickie S | $112,000 | Fati | |
| Allhome Restoration Llc | $57,500 | Sovereign | |
| Wells Fargo Bank Na | $80,000 | Sovereign | |
| Stults Christi R | $105,000 | -- |
Source: Public Records
Mortgage History
| Date | Status | Borrower | Loan Amount |
|---|---|---|---|
| Previous Owner | Waybright Mickie S | $3,754 | |
| Previous Owner | Waybright Mickie S | $111,122 |
Source: Public Records
Tax History Compared to Growth
Tax History
| Year | Tax Paid | Tax Assessment Tax Assessment Total Assessment is a certain percentage of the fair market value that is determined by local assessors to be the total taxable value of land and additions on the property. | Land | Improvement |
|---|---|---|---|---|
| 2024 | $3,089 | $70,670 | $14,490 | $56,180 |
| 2023 | $3,067 | $70,665 | $14,490 | $56,175 |
| 2022 | $2,219 | $38,860 | $6,200 | $32,660 |
| 2021 | $2,084 | $38,860 | $6,200 | $32,660 |
| 2020 | $2,041 | $38,440 | $6,200 | $32,240 |
| 2019 | $1,845 | $30,210 | $4,970 | $25,240 |
| 2018 | $1,944 | $30,210 | $4,970 | $25,240 |
| 2017 | $1,887 | $30,210 | $4,970 | $25,240 |
| 2016 | $1,991 | $30,490 | $5,040 | $25,450 |
| 2015 | $2,008 | $30,490 | $5,040 | $25,450 |
| 2014 | $2,009 | $30,490 | $5,040 | $25,450 |
| 2013 | $1,062 | $33,880 | $5,600 | $28,280 |
Source: Public Records
Map
Nearby Homes
- 451 Beaver Ave
- 4489 Saint Margaret Ln
- 571 S Hamilton Rd
- 353 Shell Ct E
- 579 Westphal Ave
- 4653 Kae Ave
- 469 Cumberland Dr
- 4780 Etna Rd Unit 782
- 424 Cumberland Dr
- 4662 Jae Ave
- 4212 Seigman Ave
- 4232 Mayflower Blvd
- 4148 Elbern Ave
- 322 Fairway Cir
- 547 Country Club Rd
- 798 S Yearling Rd
- 1085 S Hamilton Rd
- 4094 E Main St
- 963 Erickson Ave
- 4144 Mcallister Ave
- 419 Beaver Ave
- 435 Beaver Ave
- 411 Beaver Ave
- 443 Beaver Ave
- 424 Bernhard Rd
- 432 Bernhard Rd
- 416 Bernhard Rd
- 403 Beaver Ave
- 440 Bernhard Rd
- 430 Beaver Ave
- 438 Beaver Ave
- 422 Beaver Ave
- 422 Beaver Ave Unit 5
- 408 Bernhard Rd
- 446 Beaver Ave
- 395 Beaver Ave
- 448 Bernhard Rd
- 414 Beaver Ave
- 459 Beaver Ave
- 454 Beaver Ave