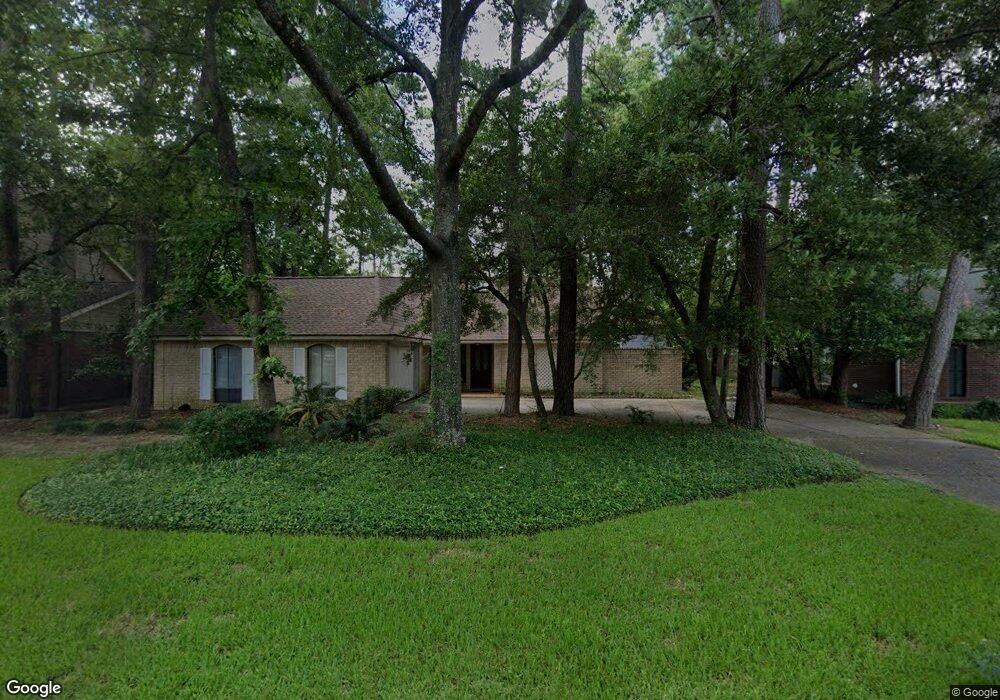
427 Champion Lake Dr Spring, TX 77380
Grogan's Mill NeighborhoodEstimated Value: $420,182 - $510,000
4
Beds
3
Baths
2,428
Sq Ft
$191/Sq Ft
Est. Value
About This Home
This home is located at 427 Champion Lake Dr, Spring, TX 77380 and is currently estimated at $462,546, approximately $190 per square foot. 427 Champion Lake Dr is a home located in Montgomery County with nearby schools including Lamar Elementary School, W.D Wilkerson Intermediate School, and Knox J High School.
Ownership History
Date
Name
Owned For
Owner Type
Purchase Details
Closed on
Feb 27, 2007
Sold by
Casanova Veronica and Swik Gail E
Bought by
Baumgartner Janet S and Barnes Erwin E
Current Estimated Value
Home Financials for this Owner
Home Financials are based on the most recent Mortgage that was taken out on this home.
Original Mortgage
$9,200
Interest Rate
6.32%
Mortgage Type
Stand Alone Second
Purchase Details
Closed on
Jul 27, 2006
Sold by
Swik Gail E
Bought by
Baumgartner Janet S and Barnes Erwin E
Purchase Details
Closed on
Jul 9, 2001
Sold by
Lightfoot Phillip Gene and Lightfoot Therese Hannon
Bought by
Casanova Veronica and Swik Gail E
Home Financials for this Owner
Home Financials are based on the most recent Mortgage that was taken out on this home.
Original Mortgage
$100,000
Interest Rate
7.2%
Purchase Details
Closed on
Jun 1, 1987
Bought by
Baumgartner Janet S and Barnes Erwin E
Create a Home Valuation Report for This Property
The Home Valuation Report is an in-depth analysis detailing your home's value as well as a comparison with similar homes in the area
Home Values in the Area
Average Home Value in this Area
Purchase History
| Date | Buyer | Sale Price | Title Company |
|---|---|---|---|
| Baumgartner Janet S | -- | Old Republic Title | |
| Baumgartner Janet S | -- | -- | |
| Casanova Veronica | -- | Chicago Title | |
| Baumgartner Janet S | -- | -- |
Source: Public Records
Mortgage History
| Date | Status | Borrower | Loan Amount |
|---|---|---|---|
| Closed | Baumgartner Janet S | $9,200 | |
| Open | Baumgartner Janet S | $147,200 | |
| Previous Owner | Casanova Veronica | $100,000 |
Source: Public Records
Tax History Compared to Growth
Tax History
| Year | Tax Paid | Tax Assessment Tax Assessment Total Assessment is a certain percentage of the fair market value that is determined by local assessors to be the total taxable value of land and additions on the property. | Land | Improvement |
|---|---|---|---|---|
| 2025 | $1,136 | $325,321 | -- | -- |
| 2024 | $1,136 | $295,746 | -- | -- |
| 2023 | $993 | $268,860 | $62,400 | $321,610 |
| 2022 | $4,649 | $244,420 | $62,400 | $293,310 |
| 2021 | $4,479 | $222,200 | $18,850 | $211,150 |
| 2020 | $4,291 | $202,000 | $18,850 | $183,150 |
| 2019 | $4,717 | $214,940 | $18,850 | $196,090 |
| 2018 | $3,406 | $221,540 | $18,850 | $206,030 |
| 2017 | $4,505 | $201,400 | $18,850 | $182,550 |
| 2016 | $4,505 | $201,400 | $18,850 | $182,550 |
| 2015 | $2,669 | $214,450 | $18,850 | $195,600 |
| 2014 | $2,669 | $199,270 | $18,850 | $180,420 |
Source: Public Records
Map
Nearby Homes
- 25706 Overlake Dr
- 402 Pine Edge Dr
- 25606 Pecan Valley Cir
- 25607 Pecan Valley Cir
- 25427 Elm Creek Dr
- 25419 Elm Creek Dr
- 34 Lyrebird Dr
- 17 Night Hawk Place
- 722 Shadowbrook Dr
- 723 Shadowbrook Dr
- 90 Crystal Lake Ln
- 424 Nursery Rd
- 13 Honey Daffodil Place
- 119 Heatherwood Dr
- 426 Nursery Rd
- 67 Marabou Place
- 33 Crystal Lake Ln
- 51 Marabou Place
- 713 Sawdust Rd
- 0 Sagewood
- 423 Champion Lake Dr
- 431 Champion Lake Dr
- 25618 Walnut Grove Cir
- 25618 Walnut Grove Cr Cir
- 25615 Walnut Grove Cir
- 435 Champion Lake Dr
- 25614 Pine Acres Cir
- 426 Champion Lake Dr
- 430 Champion Lake Dr
- 419 Champion Lake Dr
- 422 Champion Lake Dr
- 434 Champion Lake Dr
- 25614 Walnut Grove Cir
- 25611 Walnut Grove Cir
- 25618 Pine Acres Cir
- 439 Champion Lake Dr
- 25610 Pine Acres Cir
- 418 Champion Lake Dr
- 419 Pine Edge Dr
- 423 Pine Edge Dr