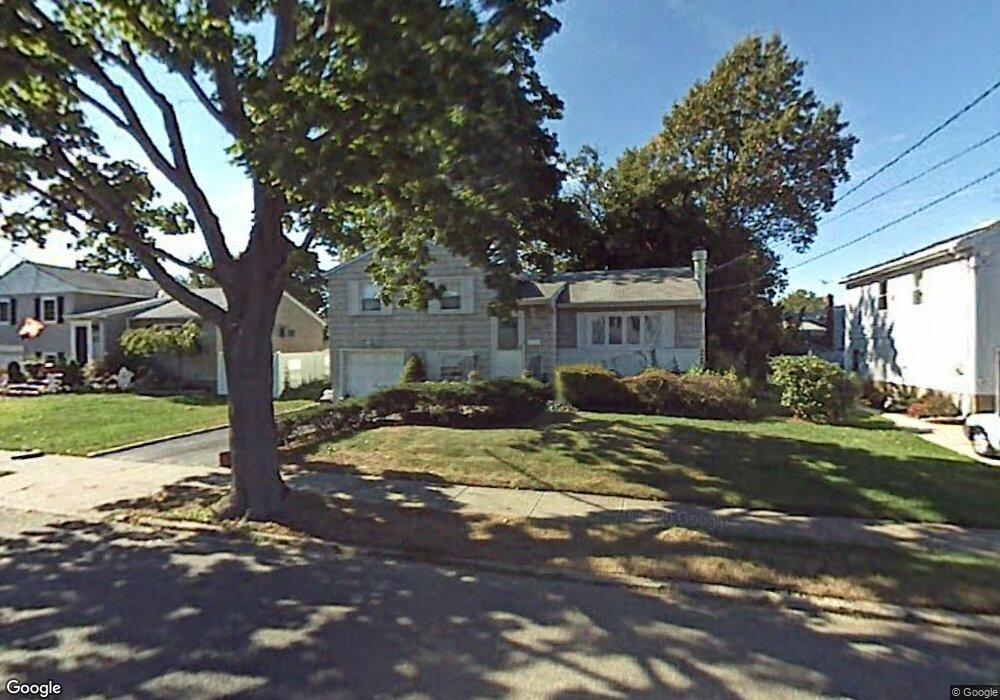
428 Broadway Massapequa Park, NY 11762
Estimated Value: $785,869 - $882,000
3
Beds
3
Baths
1,088
Sq Ft
$766/Sq Ft
Est. Value
About This Home
This home is located at 428 Broadway, Massapequa Park, NY 11762 and is currently estimated at $833,935, approximately $766 per square foot. 428 Broadway is a home located in Nassau County with nearby schools including Massapequa High School - Ames Campus, Berner Middle School, and Massapequa High School.
Ownership History
Date
Name
Owned For
Owner Type
Purchase Details
Closed on
Apr 9, 2018
Sold by
Jjr428 Corp
Bought by
Marrone Vanessa and Marrone Jason
Current Estimated Value
Home Financials for this Owner
Home Financials are based on the most recent Mortgage that was taken out on this home.
Original Mortgage
$441,750
Outstanding Balance
$380,074
Interest Rate
4.46%
Mortgage Type
New Conventional
Estimated Equity
$453,861
Purchase Details
Closed on
Jun 12, 2017
Sold by
Garbarino Roy and Garbarino Robert
Bought by
Jjr 428 Corporation
Create a Home Valuation Report for This Property
The Home Valuation Report is an in-depth analysis detailing your home's value as well as a comparison with similar homes in the area
Home Values in the Area
Average Home Value in this Area
Purchase History
| Date | Buyer | Sale Price | Title Company |
|---|---|---|---|
| Marrone Vanessa | $590,000 | None Available | |
| Jjr 428 Corporation | $417,000 | Judicial Title |
Source: Public Records
Mortgage History
| Date | Status | Borrower | Loan Amount |
|---|---|---|---|
| Open | Marrone Vanessa | $441,750 |
Source: Public Records
Tax History Compared to Growth
Tax History
| Year | Tax Paid | Tax Assessment Tax Assessment Total Assessment is a certain percentage of the fair market value that is determined by local assessors to be the total taxable value of land and additions on the property. | Land | Improvement |
|---|---|---|---|---|
| 2025 | $12,347 | $472 | $271 | $201 |
| 2024 | $3,084 | $472 | $271 | $201 |
| 2023 | $10,883 | $472 | $271 | $201 |
| 2022 | $10,883 | $472 | $271 | $201 |
| 2021 | $10,189 | $491 | $201 | $290 |
| 2020 | $11,276 | $623 | $569 | $54 |
| 2019 | $8,867 | $623 | $569 | $54 |
| 2018 | $8,867 | $623 | $0 | $0 |
| 2017 | $2,845 | $623 | $569 | $54 |
| 2016 | $4,644 | $623 | $512 | $111 |
| 2015 | $1,599 | $658 | $481 | $177 |
| 2014 | $1,599 | $658 | $481 | $177 |
| 2013 | $1,510 | $693 | $507 | $186 |
Source: Public Records
Map
Nearby Homes